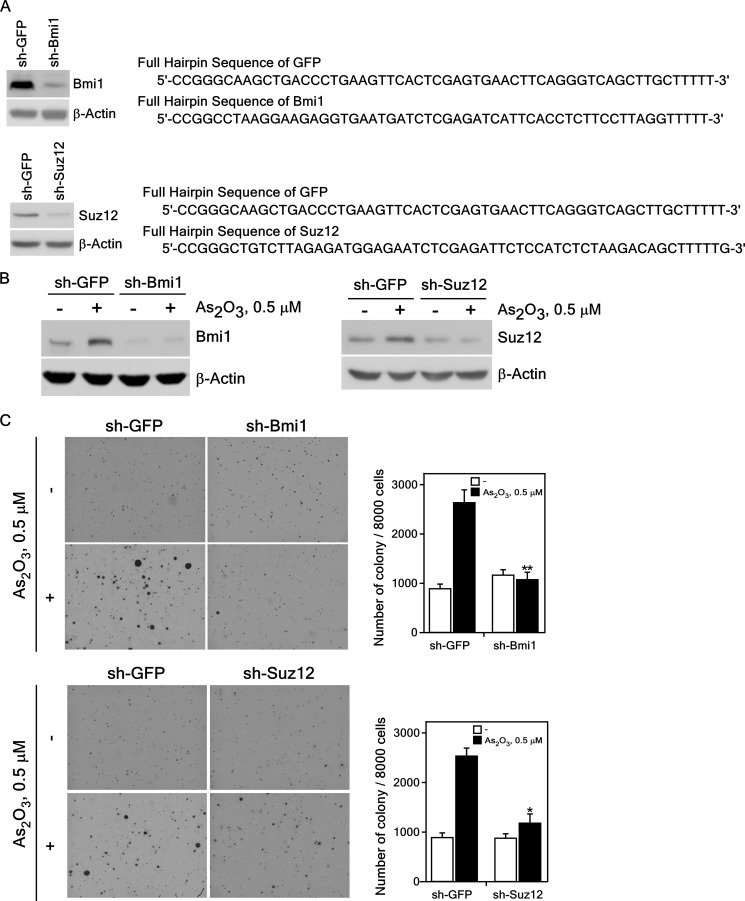
FIGURE 4.
Knockdown of PcG proteins suppresses the anchorage-independent growth of BALB/c 3T3 cells exposed to a low dose of arsenic. A, knockdown of BMI1 or SUZ12 efficiently suppresses the endogenous BMI1 (upper left panel) or SUZ12 (bottom left panel) protein level. The DNA sequences of the sh-GFP, sh-BMI1 (upper right panel) and sh-SUZ12 (bottom right panel) are shown. Knockdown BMI1 or SUZ12 BALB/c 3T3 cells were constructed as described under “Experimental Procedures.” The expression of BMI1 (upper left panel) or SUZ12 (bottom left panel) was analyzed in the stable transfected BALB/c 3T3 cells. B, expression of BMI1 (left panel) or SUZ12 (right panel) proteins in BALB/c 3T3 cells treated with arsenic for 2 weeks. Lysate proteins were resolved by 10% SDS-PAGE, and the protein bands were visualized by Western blotting with a specific BMI1 or SUZ12 primary antibody and an HRP-conjugated secondary antibody. Detection of total β-actin was used to verify equal protein loading. C, cell transforming activity induced by arsenic is decreased in knockdown BMI1 (upper panel) or SUZ12 (bottom panel) stably infected BALB/c 3T3 cells. sh-GFP, sh-BMI1 or sh-SUZ12 stably infected cells were exposed to 0.5 μm of As2O3 in 0.1 m NaHCO3 for 2 weeks and these cells (8 × 10³) were cultured in 1 ml of 0.3% BME agar containing 10% CS. The cultures were maintained at 37 °C in a 5% CO2 atmosphere for 7 days and then colonies were counted using a microscope and the Image-Pro PLUS (v.6) computer software program. The average colony number was calculated and photographed from three separate experiments, and representative plates are shown. Significant differences were evaluated using the Student's t test, and the respective asterisks indicate a significant decrease in arsenic-induced sh-Bmi1 or sh-SUZ12 cell transformation compared with sh-GFP cells (*, p < 0.01; **, p < 0.001).

