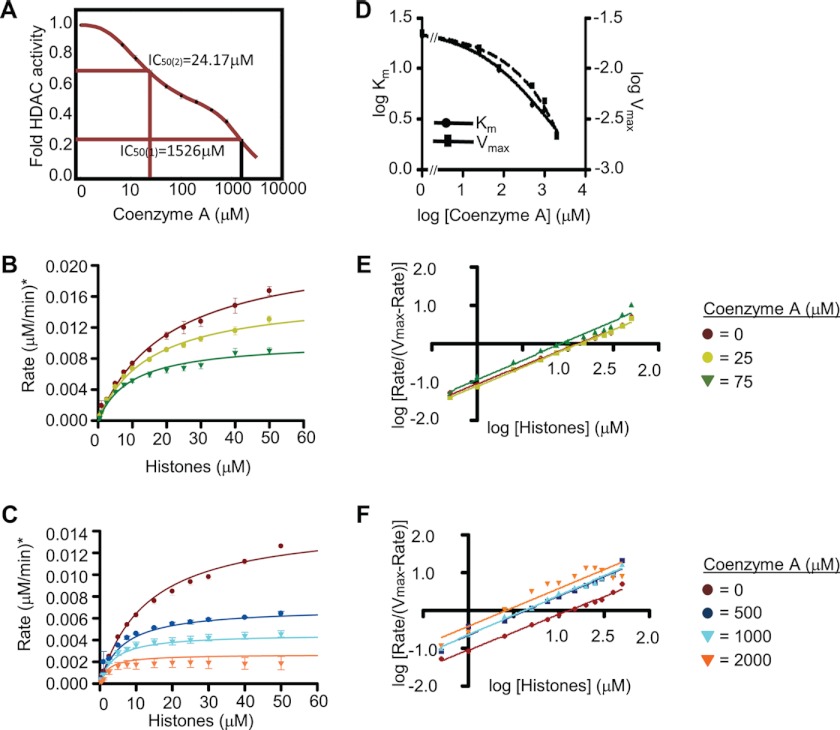
FIGURE 3.
Kinetics of HDAC2 inhibition by coenzyme A. A, determination of the effective concentration of CoA. 25 nm recombinant HDAC2 and 50 μm 3H-labeled histones were incubated with increasing amounts of CoA, and in vitro HDAC activity was determined. The graph depicts fold change in HDAC activity over basal activity. B, analysis of kinetics of inhibition by CoA. 25 nm recombinant HDAC2 was incubated with increasing amounts of 3H-labeled histones (0–2000 μm) without or in the presence of 25 or 75 μm CoA. The graph shows the rate of histone deacetylation (μm histones deacetylated per min). C, same as B, but in the presence of 500, 1000, and 2000 μm CoA. D, log Km and log Vmax values with increasing amounts of CoA, as determined from B and C. E, curve fitting of data in B using the Hill equation. F, curve fitting of data in C using the Hill equation. Error bars represent the standard deviation of three independent experiments.

