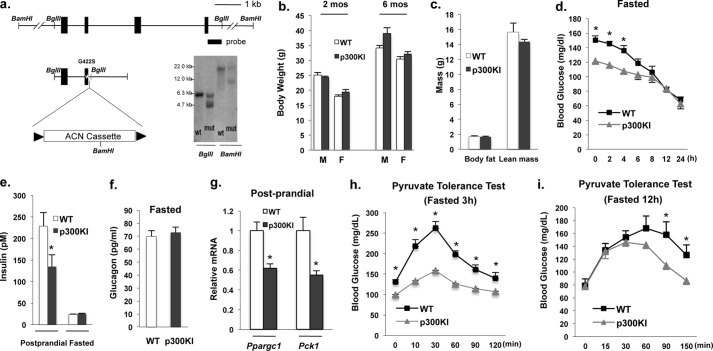
FIGURE 4.
Characterization of p300(G422S) knock-in mice. a, generation of p300(G422S) knock-in mice. A representative Southern blot is shown. b and c, body weights (b) and body composition (c) of p300(G422S) knock-in mice and littermates (n = 4). d, blood glucose levels of WT and p300(G422S) knock-in mice during the period of 24 h fasting (n = 5–6). e and f, serum insulin levels in post-prandial and fasting states (16 h) mice (e), and fasting glucagon levels (16 h) (f) (n = 5–6). g, p300(G422S) knock-in exhibited lower mRNA levels of Ppargc1 and Pck1 gene in the liver. h and i, pyruvate tolerance test in mice fasted for 3 h (n = 6) or 12 h (n = 4). Asterisk signifies that groups with same treatment are significantly different (p < 0.05). 2 mos, 2 months; mut, mutant; p300KI, P300 knock-in mice.

