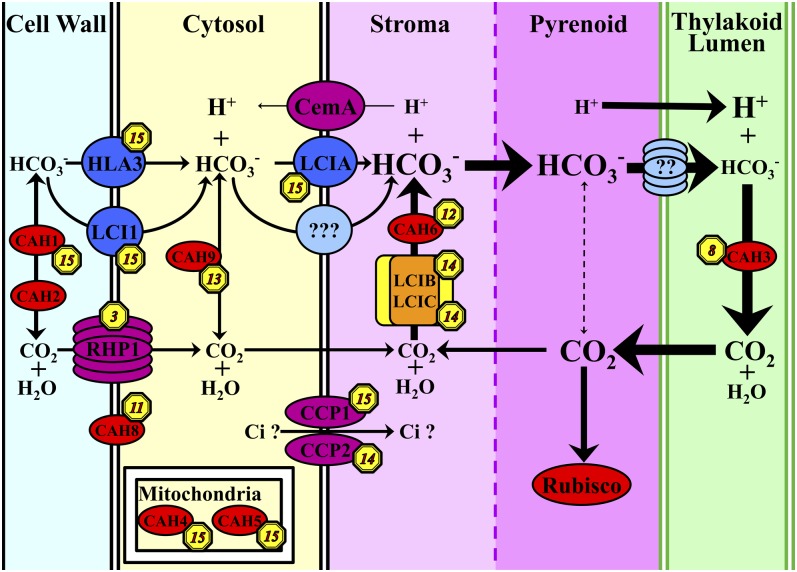
Figure 3.
Gene Cluster Distribution within a Hypothetical CCM/Ci Transport Model.
The cluster label for each gene is indicated by a yellow octagon containing a cluster number. In this schematic representation of the CCM, most of the putative CCM elements and many previously identified CO2-responsive genes, including the putative Ci transporters HLA3, LCI1, LCIA, CCP1, and CCP2 and CCM-related CAs CAH1 and CAH3, and other indentified CCM genes like LCIB and LCIC are indicated as having expression patterns categorized in the “CCM clusters (clusters 8, 14, and 15).” This figure is modified from Wang et al. (2011), with the addition of the LCI chloroplast membrane proteins CCP1 and CCP2 (Chen et al., 1997) and CA locations (Moroney et al., 2011). Transport proteins with demonstrated CCM function are shown in dark blue, known transport proteins with suspected CCM function are shown in purple, predicted but unknown transport proteins are shown in light blue, known soluble enzymes are shown in red, and the soluble LCIB/LCIC complex is shown in orange and yellow.

