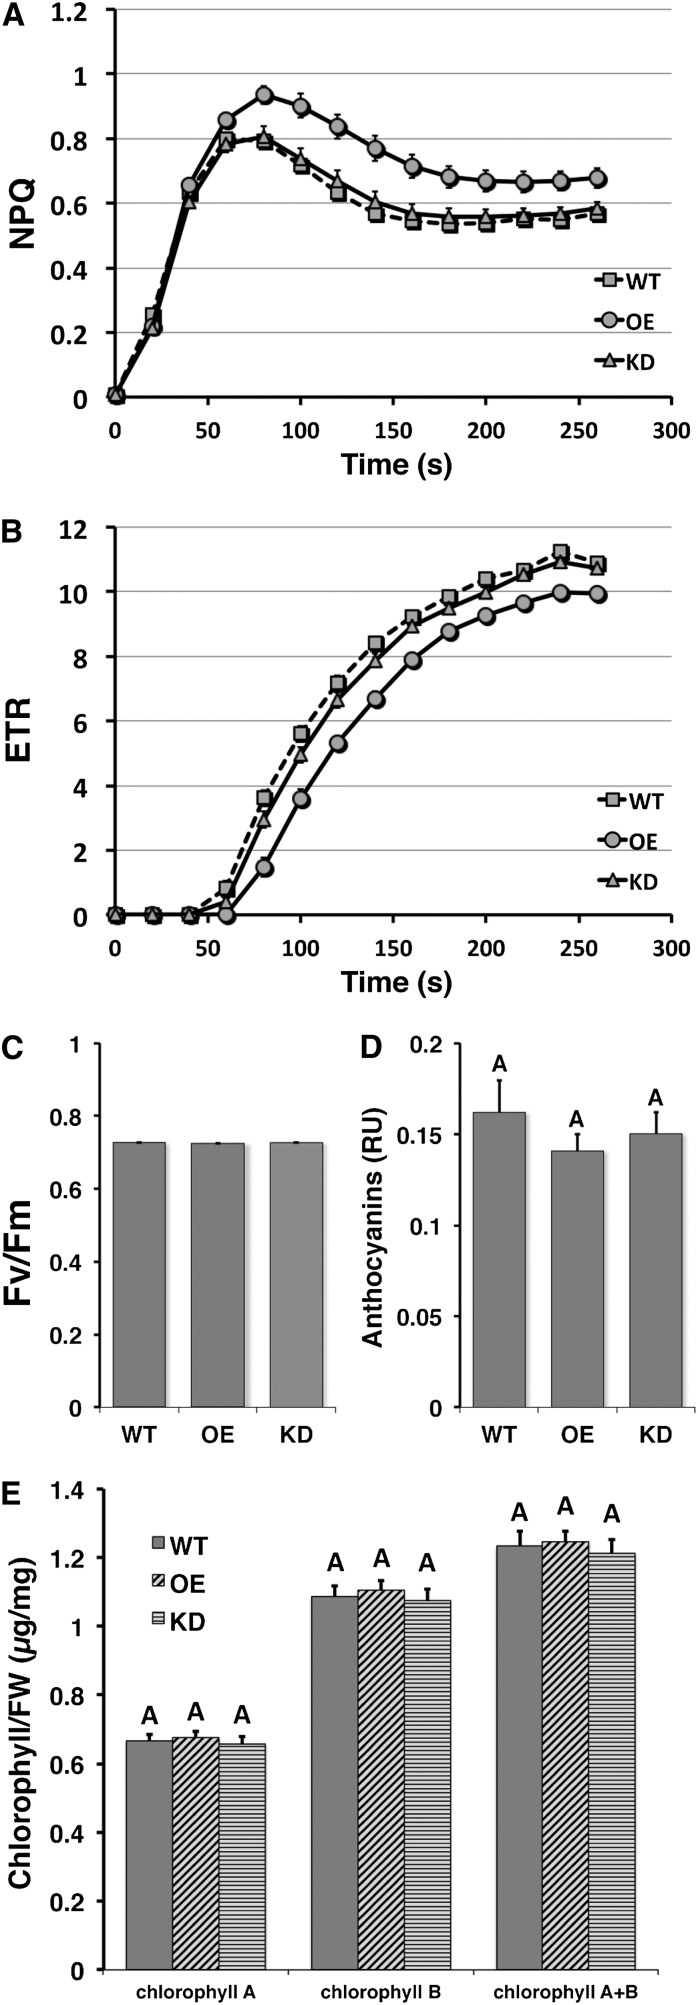
Figure 8.
Elevated ACHT1 Expression Results in Altered NPQ and ETR but Not in Fv/Fm Values or Chlorophyll and Anthocyanin Content.
(A) Time course of NPQ was calculated according to Maxwell and Johnson (2000) from traces of fluorescence induction in 16-h dark-adapted wild-type (WT), ACHT1 OE, and ACHT1 KD lines illuminated with 80 μE/m2s actinic light.
(B) ETR was calculated from traces of fluorescence induction as in (A).
(C) The maximal quantum yield (Fv/Fm) of the plants was measured before light induction.
(D) Anthocyanins content was determined from the absorbance at 530 and 657 nm of extracts of 14-d-old plants, and the results are expressed as (A530 – A637) × 1000 per milligram of plant weight (relative units [RU]).
(E) Chlorophyll a, chlorophyll b, and chlorophyll a+b concentrations were determined in extracts of 14-d-old plants as described (Porra et al., 1989). FW, fresh weight.
Plants were grown at 20°C/18°C under 8/16 h light/dark cycle using fluorescent white light at approximately 80 μE/m2s. Results from two KD lines (SALK_089128 and SALK_144456) were pooled together as well as the results from two OE lines (2-25 and 2-28). Data represent mean and se (n = 20 for photosynthetic parameter measurements and n = 6 for anthocyanin and chlorophyll determination). Means sharing the same letter are not significantly different based on the Tukey-Kramer honestly significant difference test using a P value cutoff of 0.05.

