Figure 2.
FHY1 Phosphorylation Promotes Cytoplasmic Localization.
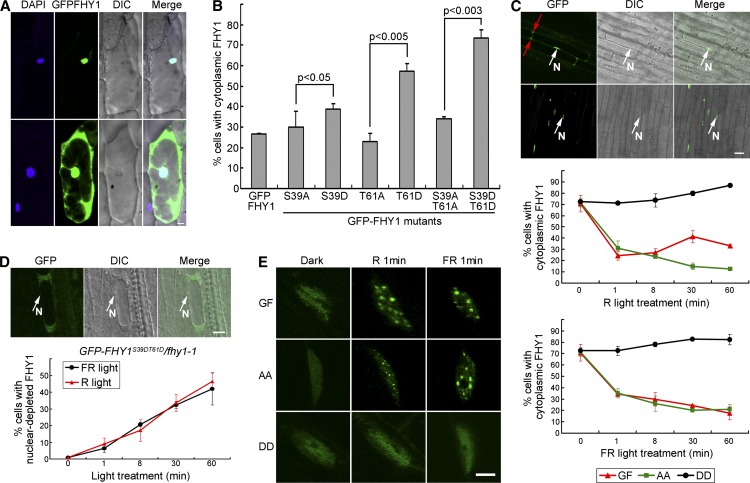
(A) FHY1 localizes in the nucleus (top) or stays ubiquitously distributed (bottom). Onion epidermal cells expressing GFP-FHY1 by bombardment were incubated in the dark for 36 h followed by a 2-min white light pulse. The 4′,6-diamidino-2-phenylindole (DAPI)-stained nucleus is shown in blue. DIC, differential interference contrast. Bar = 20 µm.
(B) P-mimic FHY1 prefers cytoplasmic localization. Onion cells expressing the indicated GFP-FHY1 mutants were counted according to their nuclear-cytoplasmic distribution pattern after 36-h dark incubation and a 2-min white light pulse. Mean ± sd (n > 150); P values are from Student’s t tests.
(C) FHY1 phosphorylation mutants exhibit abnormal localization patterns in FR and R in Arabidopsis. Top panel: GFP-FHY1 localizes to the nucleus (top panel) or stays ubiquitously distributed (bottom panel) in hypocotyl cells of a 4-d etiolated GFP-FHY1/fhy1-1 (GF). Red and white arrows indicate cytoplasmic and nuclear localization (N), respectively. Middle and bottom panels: 4-d etiolated GF, GFP-FHYS39AT61A/fhy1-1 (AA), and GFP-FHY1S39DT61D/fhy1-1 (DD) seedlings were exposed to R (middle) or FR (bottom) for indicated time periods. Cells were counted at the end of the indicated light exposure period. Mean ± sd (n > 150). Bar = 20µm.
(D) Nuclear-excluded distribution of P-mimic GFP-FHY1 with extended R or FR treatments. A 4-d etiolated DD seedling exposed to FR for 1 h shows a typical nuclear-excluded localization of the protein (top panels). Proportion of cells containing nuclear-excluded DD protein over the indicated time periods under R (the red line) or FR (the black line) treatment is shown in the bottom. Mean ± sd (n > 150). Bar = 20 µm.
(E) P-mimic FHY1 is unable to localize to nuclear bodies. Etiolated (4 d) GF, AA, and DD seedlings were exposed to R or FR for 1 min, followed by immediate microscopy imaging. Bar = 5µm.

