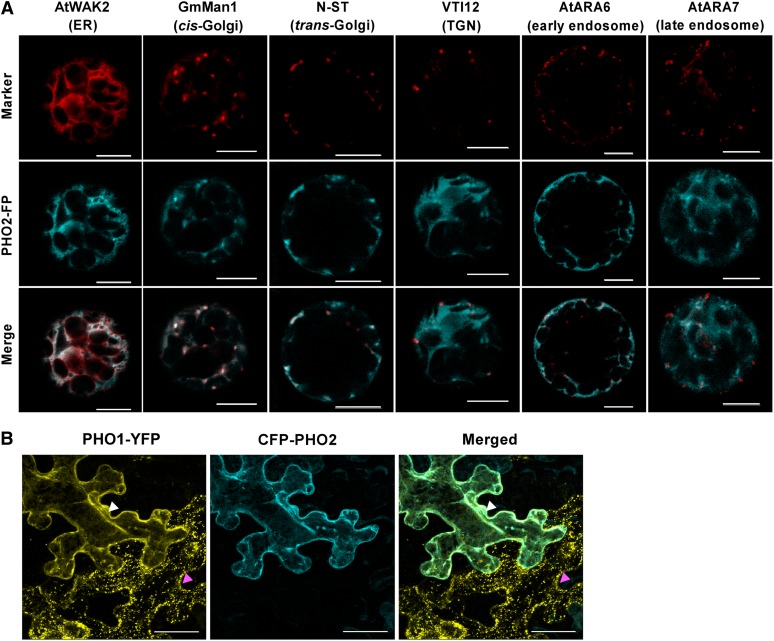
Figure 10.
Subcellular Localization of PHO2 and Colocalization of PHO1 and PHO2.
(A) Analyses of subcellular localization of PHO2 fluorescence protein (35S:PHO2-FP) using the ER, Golgi, trans-Golgi network (TGN), and endosomal markers in Arabidopsis protoplasts. PHO2-CFP proteins were used to analyze along with all of the subcellular markers, except that PHO2-RFP was employed in conjunction with the TGN marker. Bars = 10 µm.
(B) Colocalization of PHO1-YFP (35S:gPHO1insYFP) and CFP-PHO2 (35S:CFP-PHO2) in tobacco leaves. Note the punctate pattern of PHO1-YFP when expressed alone as indicated by the magenta arrowhead; the subcellular localization of PHO1 displayed an ER-like pattern when coexpressed with PHO2 as indicated by the white arrowhead. The displayed image is a maximum projected z-stack of 24 confocal slices (total z depth = 24 µm). Bars = 10 µm.

