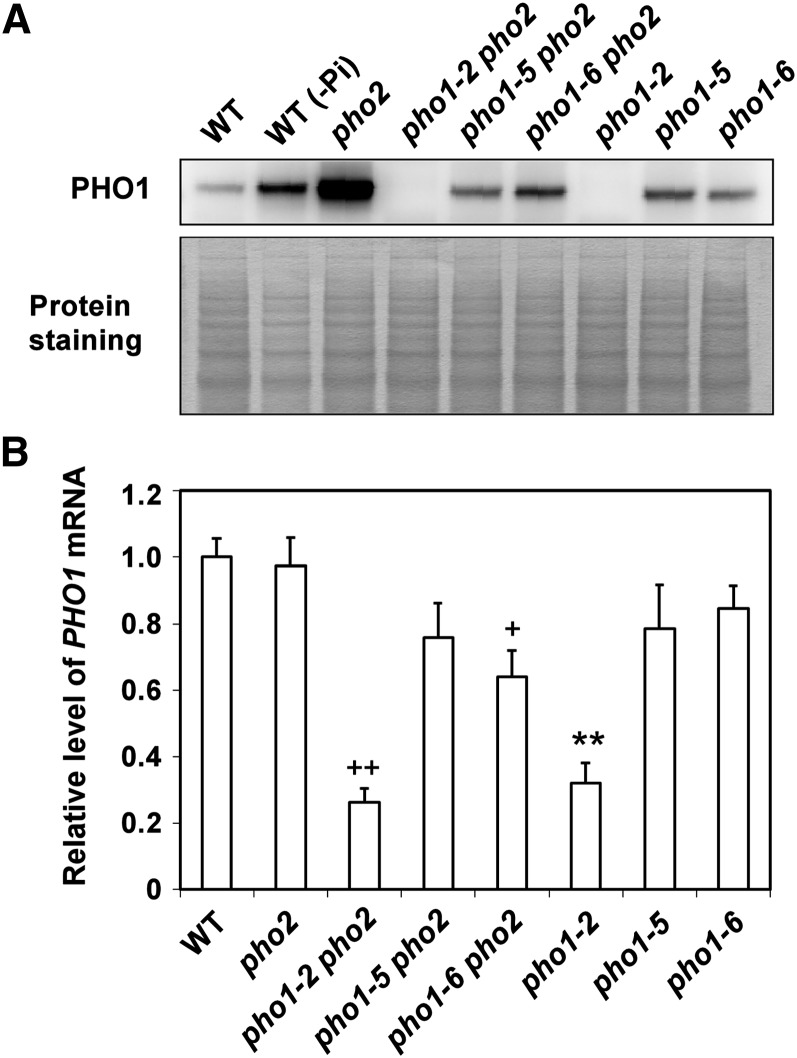
Figure 7.
Suppression of PHO1 Expression in the pho2 Suppressors.
(A) Immunoblot analysis of PHO1 in the root of 14-d-old wild-type (WT), pho2, pho1-2 pho2, pho1-5 pho2, pho1-6 pho2, pho1-2, pho1-5, and pho1-6 seedlings under +Pi conditions. A root sample from the wild-type seedling subjected to 5 d of Pi deficiency (−Pi) was used as comparison.
(B) Quantitative RT-PCR analysis of PHO1 expression in the root under +Pi conditions. Error bars represent se (n = 4 to 6, pooled from three independent experiments). Data significantly different from the corresponding controls are indicated (mutant versus the wild type, **P < 0.01; mutant versus the pho2 mutant, +P < 0.05, ++P < 0.01; Student’s t test).

