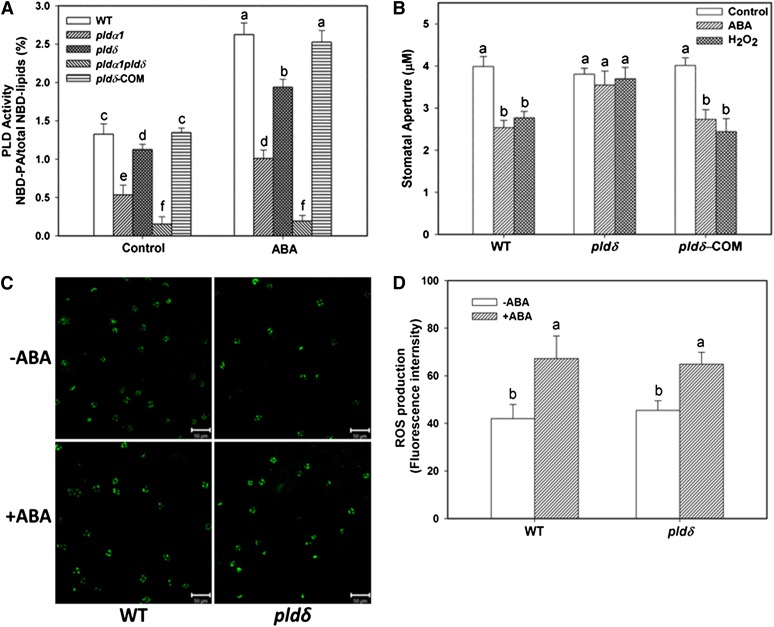
Figure 1.
Decreased Response of pldδ Plants to H2O2 and ABA.
(A) ABA-induced PA production in leaf protoplasts of pldα1, pldδ, pldα1 pldδ, PLDδ-complementation (COM), and the wild type (WT). Values are means ± se (n = 3).
(B) Stomatal closure induced by 25 µM ABA or 100 µM H2O2. Values are means ± se (n = 50).
(C) Representative image of ROS production in guard cells, visualized by fluorescent dye. +ABA, epidermal peels were loaded with H2DCF-DA for 10 min followed by addition of 25 µM ABA for 5 min; –ABA, no ABA added. Bars = 50 µm.
(D) Quantification of ROS production based on fluorescence intensity (mean pixel intensity). Values are means ± se (n = 50). Columns with different letters are significantly different from each other (ANOVA, P < 0.05).
[See online article for color version of this figure.]

