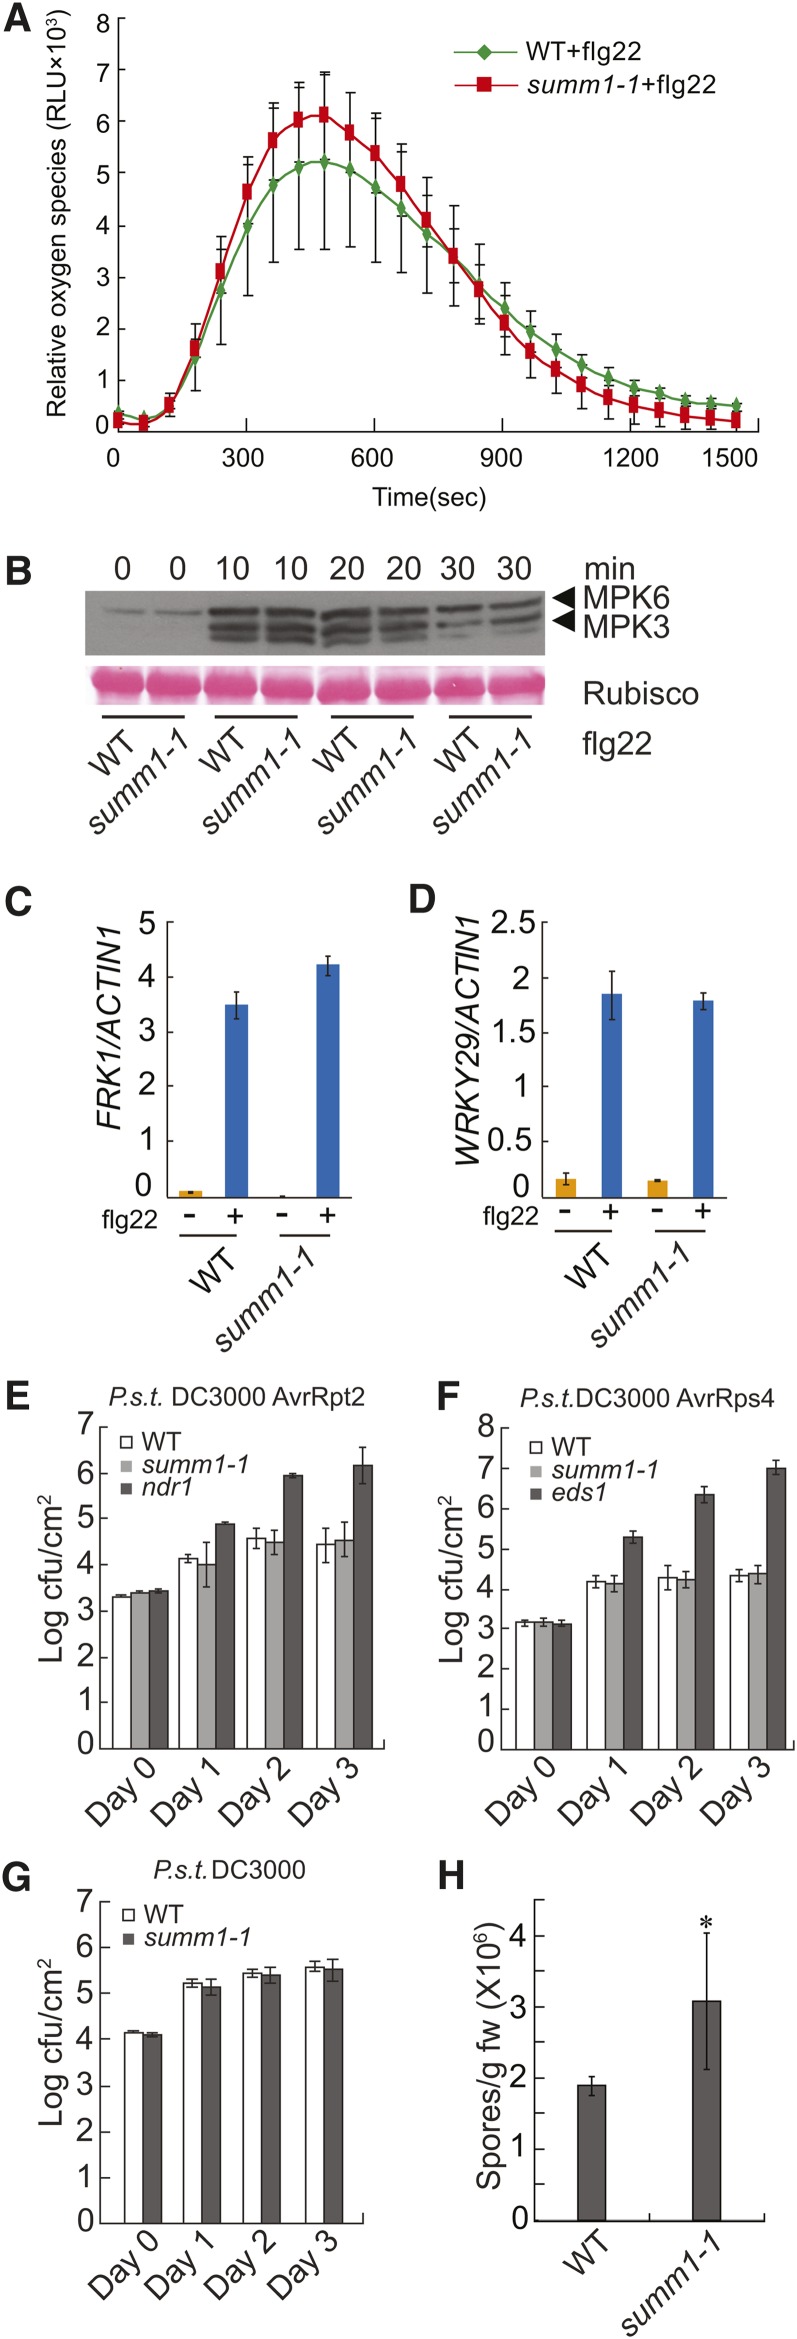
Figure 4.
Analysis of Different Immune Responses in summ1-1.
(A) flg22-induced oxidative burst in summ1-1. Leaf slices were treated with 1 μM flg22 before ROS was measured. Error bars represent the sd of 12 independent samples. RLU, relative luminescence units; WT, wild type.
(B) flg22-induced MAPKs activation. Two-week-old seedlings grown on half-strength MS medium were treated with 10 μM of flg22. Samples were collected at 0, 10, 20, and 30 min and analyzed by immunoblots using an anti-Erk antibody (Cell Signaling; #4370S).
(C) and (D) Real-time RT-PCR analysis of the induction of FRK1 (C) and WRKY29 (D) in the wild type and summ1-1 by flg22. Two-week-old seedlings grown on half-strength MS plates were sprayed with 10 μM of flg22 4 h before samples were taken. Error bars represent ±sd of three replicates.
(E) to (G) Growth of P.s.t. DC3000 avrRpt2 (E), P.s.t. DC3000 avrRps4 (F), and P.s.t. DC3000 (G) on the indicated genotypes. Five-week-old plants grown under short-day conditions were infiltrated with P.s.t. DC3000 at a concentration of OD600 = 0.002 and P.s.t. DC3000 avrRpt2 and P.s.t. DC3000 avrRps4 at a concentration of OD600 = 0.001. Samples were taken at 0 h (Day 0), 24 h (Day 1), 48 h (Day 2), and 72 h (Day 3) after inoculation, respectively. Error bars represent ±sd of six replicates.
(H) Growth of H.a. Noco2 on the wild type and summ1-1. Four-week-old plants were sprayed with spores of H.a. Noco2 at a concentration of 50,000 spores/mL. Error bars represent sd of three replicates. *P < 0.05, statistical difference from the wild type.
All experiments in this figure were independently repeated three times with similar results.
[See online article for color version of this figure.]

