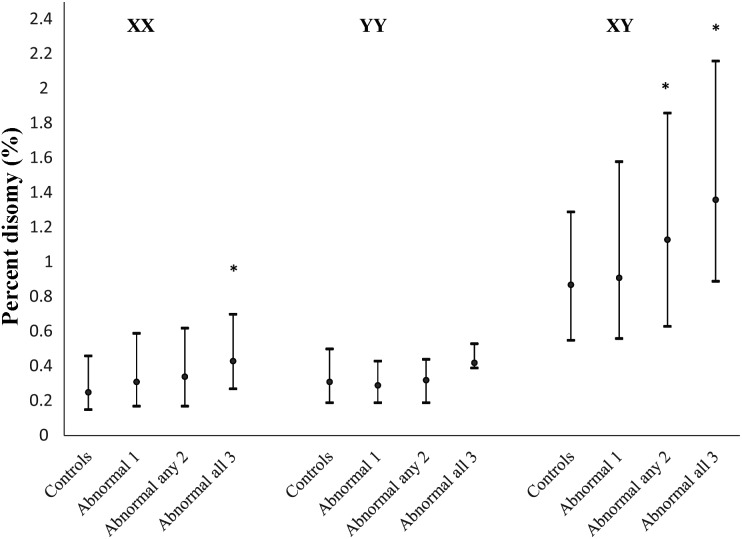
Figure 1.
Plot of 25th, median and 75th percentile for percentage XX, YY and XY disomy for men with normal semen parameters (controls) and with 1–3 abnormal semen parameters for men seeking infertility evaluation from January 2000 to May 2003 (N = 192) *P ≤ 0.05, a significant difference in median percentage disomy compared with normal controls.

