
Fig. 2.
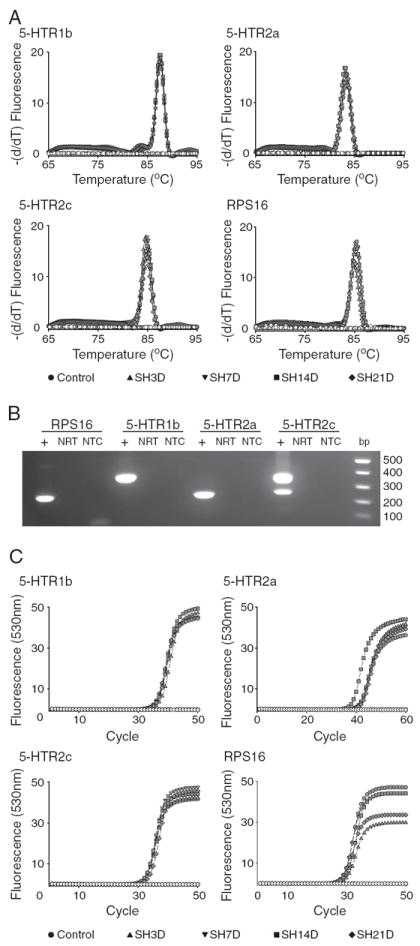
Real-time RT-PCR was used to quantify the expression of ribosomal protein S16 (RPS16) and serotonergic (5-HTR subtypes 1b, 2a and 2c) receptors in microdissected phrenic motoneurons. Experimental groups include control and spinal hemisection (SH) groups at 3, 7, 14 and 21 days post-injury. A. Melting curve analysis for each transcript showing specificity of amplification of the corresponding primer pairs (Table 1) across experimental groups (see label). B. Agarose gel electrophoresis of PCR products was used to verify transcript size. C. Representative amplification curves for serotonergic receptor transcripts and RPS16 across all experimental groups. Specificity of the PCR product was verified by including control reactions that did not include the template (NTC in B) or the RT enzyme (NRT in B; open symbols in A and C). Quantification of receptor expression was performed using the second derivative method for crossing-point (CP) analyses (see Materials and methods for details). The difference between the crossing points for each receptor transcript and RPS16 was used to determine expression levels (ΔCP) for each sample and transcript.