
Fig. 4.
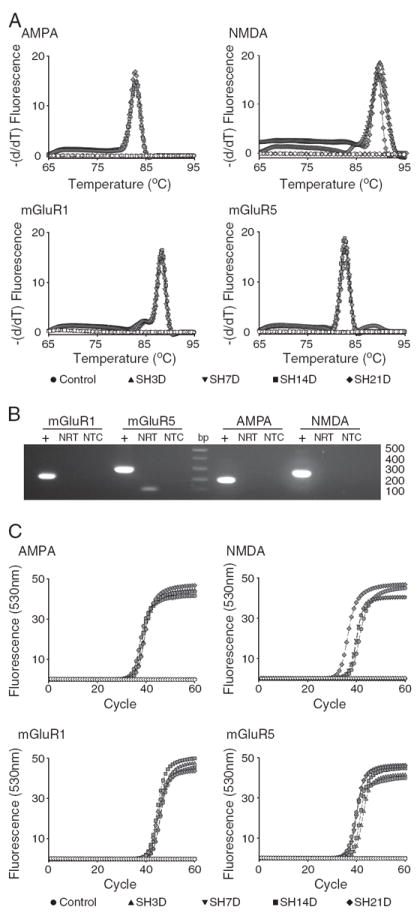
Real-time RT-PCR was used to quantify the expression of glutamatergic receptors (AMPA, NMDA, mGluR1 and mGluR5) in microdissected phrenic motoneurons. A. Melting curve analysis for each transcript showing specificity of amplification of the corresponding primer pairs (Table 1). B. Agarose gel electrophoresis of PCR products was used to verify transcript size. C. Representative amplification curves for glutamatergic receptor transcripts across all experimental groups. Quantification of receptor expression and verification of PCR product specificity was performed as in Fig. 2.