
Fig. 7.
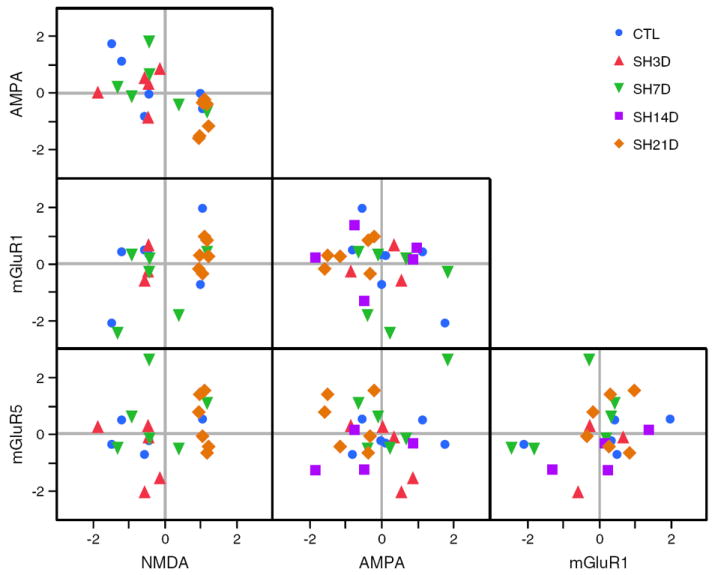
Correlation between phrenic motoneuron expression of glutamatergic receptors (AMPA, NMDA, mGluR1 and mGluR5) for all animals in each group. Each point represents the Z-score for transcript expression for an individual animal. For each animal transcript, Z-scores were calculated from the mean ΔCP across PCR reactions for that animal and overall mean and SD for all animals. Changes in mRNA transcript expression for two transcripts are shown in each box. Correlated expression (increase or decrease) results in grouping within a quadrant (right upper quadrant represents increased expression for both transcripts; left lower quadrant, decreased expression).