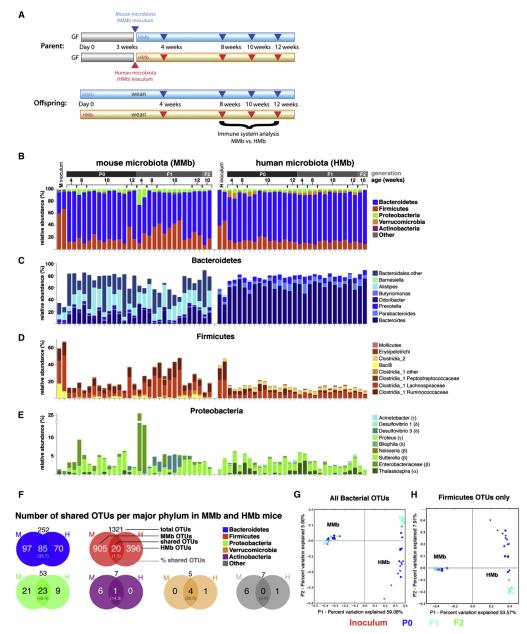
Figure 1. MMb and HMb Mouse Gut Microbiotas Are Similar in Major Bacterial Phyla Abundance with Differences at the OTU Level.
(A) Schematic of colonization model (see text for details) is illustrated. Blue and red arrowheads indicate fecal pellet collection for bacterial 16S rDNA sequencing. Offspring were sacrificed for immune system analysis. (B) Relative abundance of major bacterial phyla in the gut microbiota from MMb and HMb mice is shown. P0, parents; F1, first-generation offspring; F2, secondgeneration offspring. Each bar represents an individual mouse. Apparent differences in the Firmicutes-to-Bacteroidetes ratio between inoculum samples and recipients may have resulted from the observed differential DNA extraction performances of fecal suspensions (high water content) and fecal pellets (low water content). (C–E) Detailed relative abundance of bacterial taxa in the three most abundant major phyla is presented. (F) Number (percentage) of shared OTUs in each major bacterial phylum in MMb and HMb fecal pellets is demonstrated. See also Figures S1D and S1E. (G and H) Gut microbial communities from individual mice, clustered according to principal coordinates analysis of unweighted UniFrac distances, is illustrated. Percentages of variation explained by plotted principal coordinates P1 and P2 are indicated on the x and y axes, respectively.

