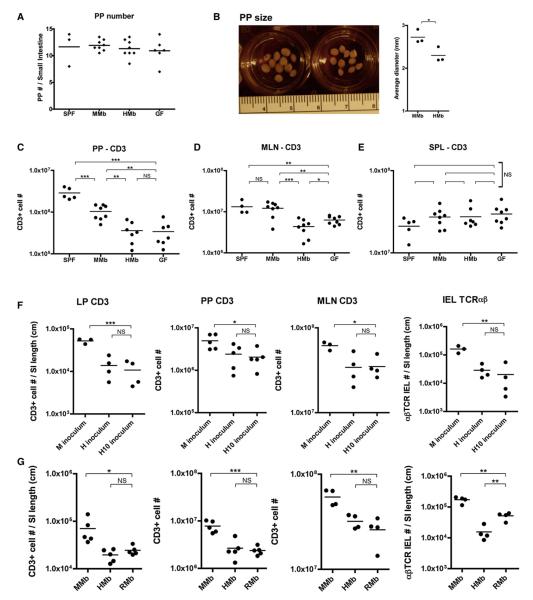
Figure 3. The MMb, but Not the HMb or RMb, Expands T Cell Populations in Small Intestinal Tissue and Secondary Gut Lymphoid Organs.
(A–C) PP number (A) and average PP size (B) per small intestine were compared. PPs were mashed, stained for CD3, and subjected to flow cytometry (C). See also Figures S3A and S3B. (D and E) Total T cell numbers in MLNs (D) and spleen (E) are shown. See also Figures S3C–S3G. (F) GF mice (3–4 weeks old) were orally gavaged with the original mouse (M) or human (H) inoculum or with feces pooled from ten additional human donors (H10 inoculum). T cell numbers were measured after 4 weeks of colonization. (G) GF mice were orally gavaged with Sprague-Dawley rat feces and bred in vinyl isolators to obtain RMb offspring. T cell numbers in age-matched MMb, HMb, and RMb offspring were compared. *p < 0.05, **p < 0.01, ***p < 0.001. NS, not significant.

