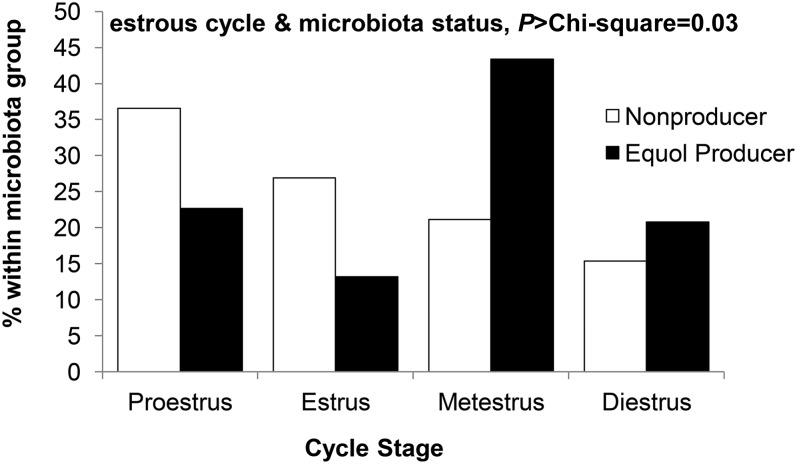
FIGURE 2.
Distribution of estrous cycle stage by microbiota status in apoE-null mice after 16 wk of dietary soy and equol treatment. Values are percentage of mice within a microbiota group in a particular estrous cycle stage (proestrus, estrus, metestrus, diestrus) at the time of necropsy, n = 52 (nonproducer) or 53 (equol producer).

