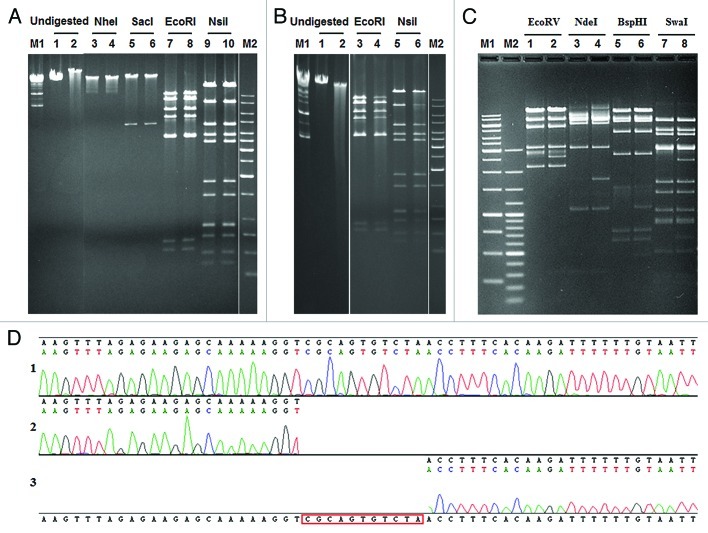
Figure 3. Structure of the ΦS9 and ΦS63 DNA molecules, as determined by gel electrophesis. (A) Restriction enzyme analysis of ΦS9 DNA using different endonucleases as indicated. Samples in lanes 2, 4, 6, 8 and 10 were heated prior to electrophoresis (see Materials and Methods section) (B) Bal31 nuclease treatment of ΦS9 DNA. (1) untreated ΦS9 DNA, (2) treated with Bal31 for 30 min. (3) EcoRI digested DNA, (4) DNA treated with Bal31 prior to digestion with EcoRI. (5) NsiI digested DNA, (6) Bal31 treated DNA and subsequently digested with NsiI. (C) Restriction profile of ΦS63 DNA using different endonucleases as indicated. Samples in lane 2, 4, 6 and 8 have been heated prior to electrophoresis. (D) Determination of single-stranded genome ends (cos-site) of ΦS63 DNA. (1) Sequence of the cos-site region of ΦS63 prophage integrated in C. perfringens. (2) Runoff-sequence of the right end and (3) left end of the ΦS63 DNA molecule, using purified ΦS63 DNA as template. M1, M2: DNA size standards (Fermentas).

An official website of the United States government
Here's how you know
Official websites use .gov
A
.gov website belongs to an official
government organization in the United States.
Secure .gov websites use HTTPS
A lock (
) or https:// means you've safely
connected to the .gov website. Share sensitive
information only on official, secure websites.
