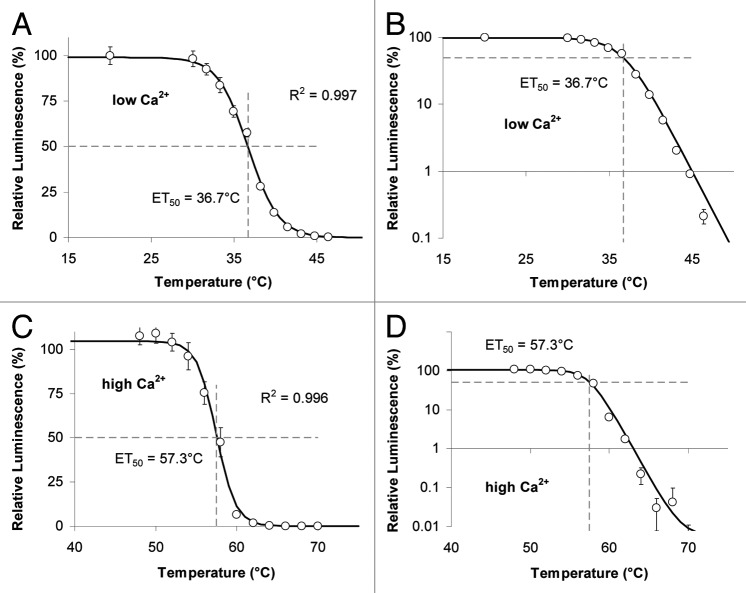
Figure 3. Heat sensitivity of LUPOs from Lepidium. (A) Peroxidases from Lepidium dissolved in a phosphate buffer of low [Ca2+] were treated with the temperatures indicated before the light yield of the H2O2-luminol reaction was measured. The temperature of 50% inactivation (ET50 = 36.7°C) is the curve's point of inflexion. (B) Data from A are plotted on a log scale to show that the ET50 is identical to the point of maximal curve bending. Data given are means of n = 5. Data are taken from.31 (C) The same experiment was performed as described in A, however this time peroxidases were kept in TriCaT-buffer (high [Ca2+]) during heat treatment. The temperature of 50% inactivation is 57.4°C. Means of n = 3 individual measurements are shown. (D) Data from C plotted on a log scale. Luminescence is expressed relative to luminescence from samples kept at RT (≈20°C). R2 are correlation coefficients obtained from curve fitting. Error bars represent StDv or are below symbol size.

An official website of the United States government
Here's how you know
Official websites use .gov
A
.gov website belongs to an official
government organization in the United States.
Secure .gov websites use HTTPS
A lock (
) or https:// means you've safely
connected to the .gov website. Share sensitive
information only on official, secure websites.
