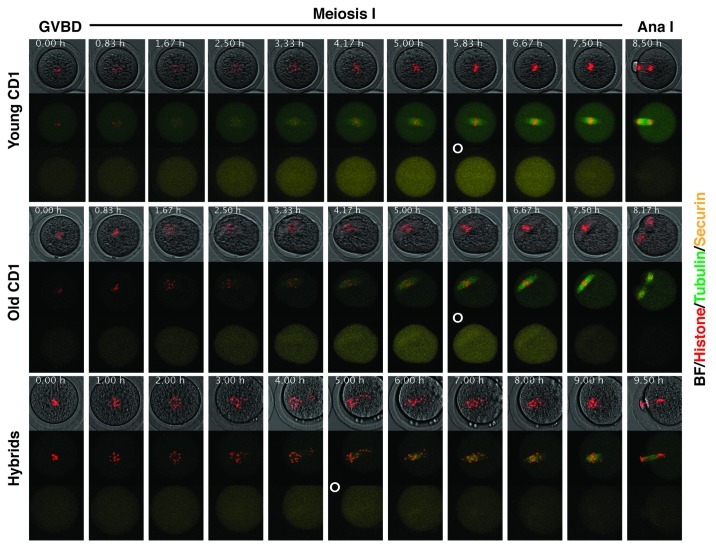
Figure 2. Time-lapse analysis of chromosome alignment and securin degradation. Oocytes were microinjected with fluorescently labeled histone H2B (red), β-tubulin 2A (green) and securin (yellow). Movie frames from representative Young CD1, Old CD1 and Hybrid oocyte are shown, the frame with maximal level of securin is marked with white circle.

An official website of the United States government
Here's how you know
Official websites use .gov
A
.gov website belongs to an official
government organization in the United States.
Secure .gov websites use HTTPS
A lock (
) or https:// means you've safely
connected to the .gov website. Share sensitive
information only on official, secure websites.
