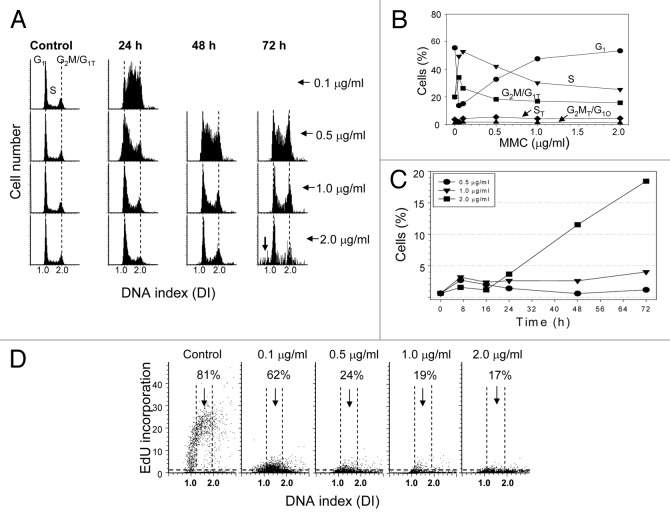
Figure 1. Effect of continuous treatment with MMC on cell cycle, apoptosis and EdU incorporation. (A) Exponentially growing A549 cells were left untreated (Control) or were continuously exposed to 0.1–2.0 µg/ml MMC for up to 72 h. A) DNA content frequency histograms; the arrow indicates objects with fractional DNA content (sub-G1), likely apoptotic cells. (B) Percentage of cells in respective phases of the cell cycle. The ST and G2MT/G1O represent cells at a higher DNA ploidy. (C) Percent of cells expressing activated (cleaved) caspase-3. (D) Exponentially growing cells untreated (Control) or treated with 0.1–2.0 µg/ml MMC for 24 h were exposed to EdU for 1 h. On these bivariate (DNA content vs EdU incorporation) distributions the cells above the dashed (threshold) line are positive for EdU. The percent of cells with an S-phase DNA content that show evidence of EdU incorporation (above the threshold) is shown in each panel.

An official website of the United States government
Here's how you know
Official websites use .gov
A
.gov website belongs to an official
government organization in the United States.
Secure .gov websites use HTTPS
A lock (
) or https:// means you've safely
connected to the .gov website. Share sensitive
information only on official, secure websites.
