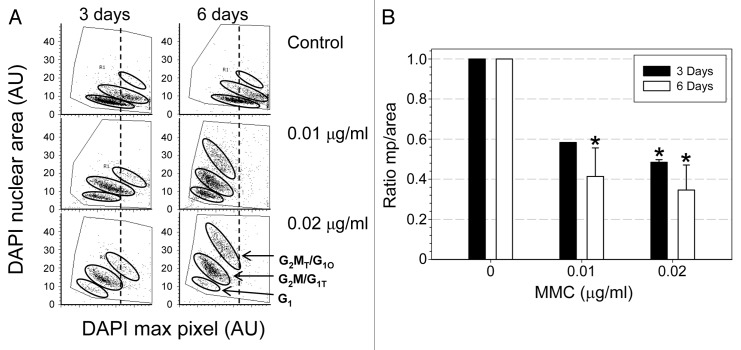
Figure 6. Morphometric changes of A549 cells growing in the presence of low concentration of MMC. The intensity of the DNA-associated (DAPI) fluorescence and nuclear area were measured by LSC as described in Materials and Methods. (A) Bivariate distributions (DAPI maximal pixel vs. nuclear area). Oval borders delineate the three main DNA ploidy cell subpopulations as marked. To better visualize the changes in the MMC-treated cells the dashed vertical line indicates the maximal pixel center of the control population of cells. Note an increase in nuclear area concomitant with a decrease in maximal pixel per each subpopulation of the MMC-treated cells. (B) The ratio of the maximum pixel (mp) to nuclear area. This ratio was significantly decreased (p < 0.05) in cells treated with MMC as indicated (*).

An official website of the United States government
Here's how you know
Official websites use .gov
A
.gov website belongs to an official
government organization in the United States.
Secure .gov websites use HTTPS
A lock (
) or https:// means you've safely
connected to the .gov website. Share sensitive
information only on official, secure websites.
