
Figure 6. RT-qPCR amplification plot and standard curve data for gtfB.
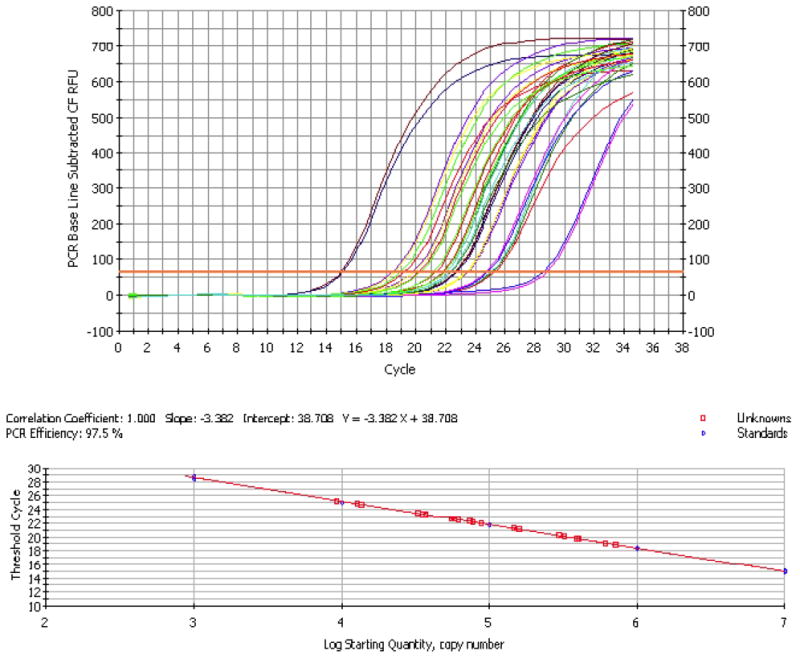
There are no RT-qPCR inhibitors in the plaque-biofilm samples and the values of expression detected for the tested samples (unknowns) are within the standard curve range.
Official websites use .gov
A
.gov website belongs to an official
government organization in the United States.
Secure .gov websites use HTTPS
A lock (
) or https:// means you've safely
connected to the .gov website. Share sensitive
information only on official, secure websites.
There are no RT-qPCR inhibitors in the plaque-biofilm samples and the values of expression detected for the tested samples (unknowns) are within the standard curve range.