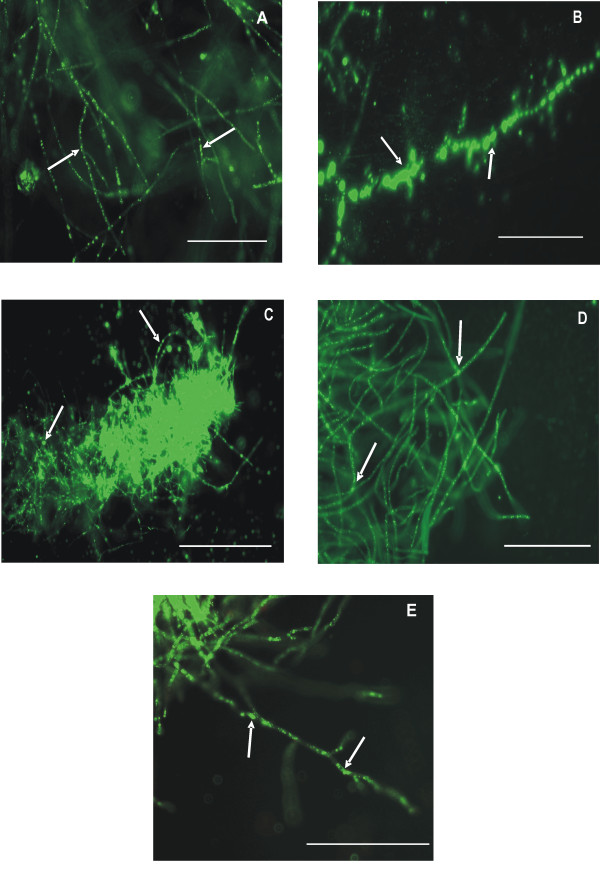
Figure 1.
Microscopic photographs of Nile red fluorescence of fungal isolates from mangrove wetlands.A) IBB B2; B) IBB F14; C) IBB G4; D) IBB G5; E) IBB M1. In the photomicrographs, the intracellular lipid bodies of hyphal cells showing fluorescence after Nile red staining are indicated by white arrows. Bar indicates 50 μm.

