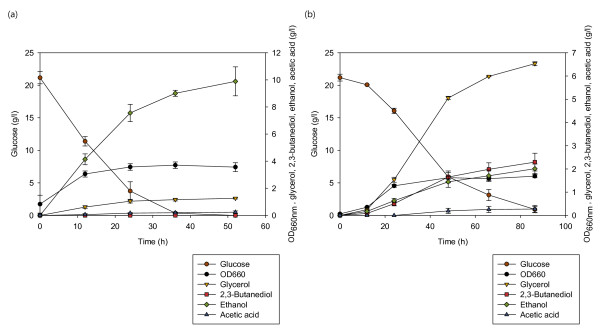
Figure 5.
Changes in metabolite concentrations for strains (a) BY4742 (wild-type) and (b) B2C-a1a3a5 under anaerobic condition. Glucose (brown circles), OD660nm (black circles), glycerol (inversed triangles), 2,3-butanediol (squares), ethanol (diamonds) and acetate (triangles) concentrations are shown. Symbols and error bars represent the mean and standard deviation for (a) triplicate and (b) duplicate experiments.

