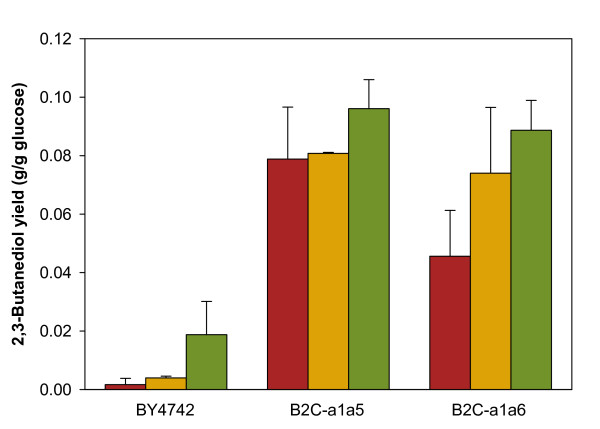
Figure 6.
Comparison of 2,3-butanediol yield with gene overexpression strategies. Each bar represents the 2,3-butanediol yield for shake-flask cultivation under microaerobic condition for three different host strains: (a) BY4742, (b) B2C-a1a5 and (c) B2C-a1a6 expressing . Red bars, host strain (reference); yellow bars, overexpression of S. cerevisiae innate BDH1; green bars, bacterial alsS-budA-budC co-expression. Values and error bars correspond to the mean and standard deviation for triplicate experiments (except for all the red bars, where four independent experiments were conducted)

