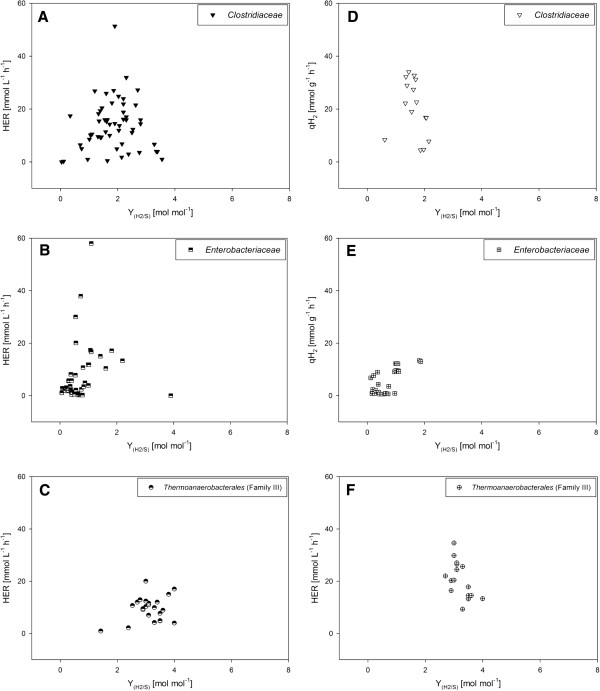
Figure 2 .
A graphical overview of the utilization of glucose is presented. HER ofClostridiaceae(A),Enterobacteriaceae(B) andThermoanaerobacterales(Family III) (C) is shown in relation to the Y(H2/S). The qH2ofClostridiaceae(D),Enterobacteriaceae(E) andThermoanaerobacterales(Family III) (F) in relation to the Y(H2/S)is also presented. These results are depicted irrespective of the medium composition, cultivation conditions or genetic modification. These graphs offer an indication that Clostridiaceae and Enterobacteriaceae show a higher volumetric productivity than Thermoanaerobacterales (Family III). In respect to the qH2Clostridiaceae and Thermoanaerobacterales (Family III) show higher productivity than Enterobacteriaceae. Based on the Y(H2/S) following ranking is presented: Thermoanaerobacterales (Family III) > Clostridiaceae > Enterobacteriaceae.

