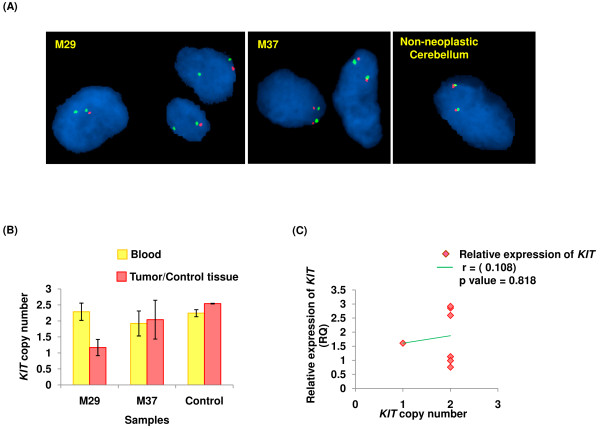
Figure 3.
Copy number status ofKITand its correlation with expression. (A) dual-colour FISH showing KIT signal (red) and centromeric sequences on chromosome 4 (green) on tissue sections (100x). M37 and non-neoplastic cerebellum (control) show normal, M29 shows decreased KIT copy number. (B) qPCR based KIT copy number results of meningioma cases; whose FISH micrographs have been shown in (A). (C) scatter plot showing relative expression of KIT Vs its copy number in immunopositive meningioma cases.

