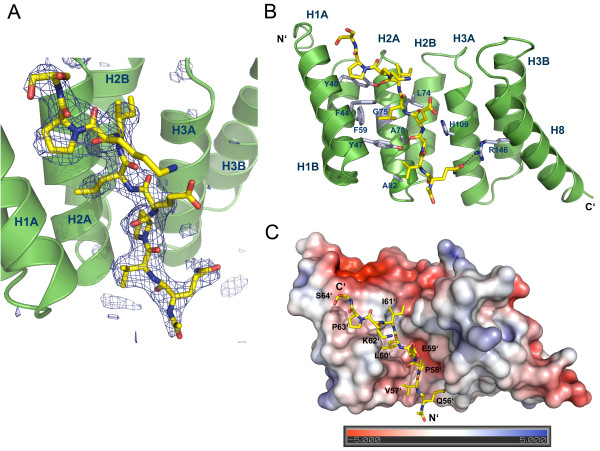
Figure 2 .
Structure of SycD in complex with the YopD peptide. (A) Positive difference electron density within the Fo-Fc map contoured at 3σ (blue mesh) assigns the position of the YopD peptide (yellow) to the concave groove of SycD (green). The Fo-Fc map was calculated via simulated annealing refinement in PHENIX [30] using the fully refined structural model whose YopD peptide chain was removed prior to refinement. (B) The YopD peptide lies antiparallel to helix H1A within the concave cleft interacting with various mainly hydrophobic residues lining H1A, H2A and H3A. Hydrogen bonds (purple lines) involving Tyr40, Tyr47 and Arg146 additionally stabilize the complex. (C) Electrostatic surface potential of the SycD:YopD complex. Three nonpolar residues Pro58’, Pro63’ and Leu60’ occupy distinct hydrophobic pockets and anchor the peptide (yellow) into the concave cleft. Negatively charged surface areas are colored in red, positively charged areas in blue.

