Figure 4.
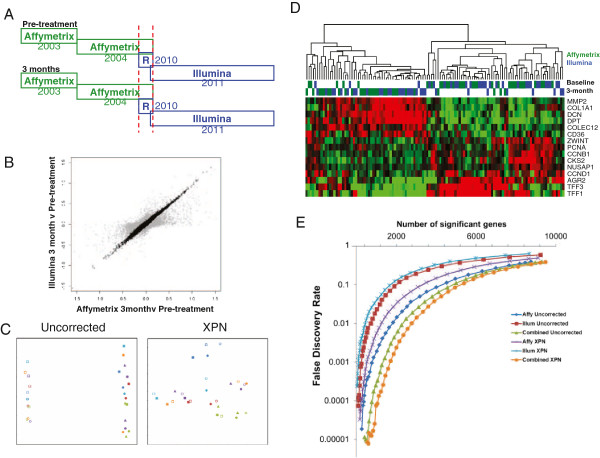
Integration of partially overlapping Affymetrix and Illumina datasets.A) Relationship between the baseline and 3 month samples processed on Affymetrix and Illumina platforms. R = repeated samples processed on Illumina BeadChips B) Scatterplot demonstrating the fold changes between the Affymetrix and Illumina datasets before (grey) and after XPN correction (black). C) Multidimensional scaling plots before and after XPN correction demonstrating the relationship between overlapping samples (circles = baseline, squares = 3 months post treatment with Letrozole, open symbols = Affymetrix, filled symbols = Illumina, triangles = Illumina repeated samples, different colours represent different patients). D) Hierarchical clustering and heatmap based on published list of genes identified as most changed between baseline and 3 month samples in patients treated with neoadjuvant Letrozole. Colour bar indicates the platform the sample was processed on with Affymetrix in green and Illumina in blue. E) Effect of cross-platform Integration and correction on differential gene expression analysis. Plot shows the relationship between the estimated false discovery rate relative to the number of significant differentially expressed genes identified using SAM analysis of Affymetrix and Illumina datasets independently and when combined both before and after XPN correction. Venn diagrams showing the overlapping genes between the 1000 most differentially expressed genes using the SAM method are available in Additional file 3.

