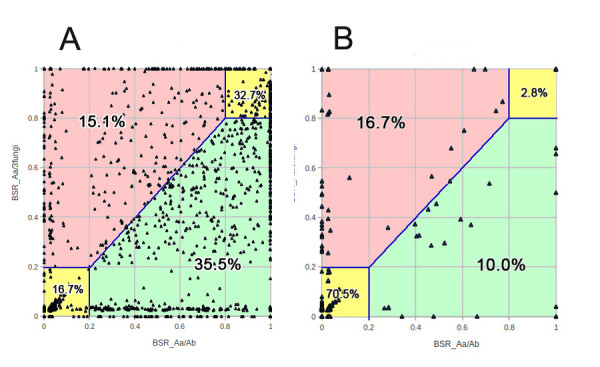
Figure 8 .

Scatter plots of BLAST Score Ratio (BSR) of EC proteins (A) and CDC proteins (B). The numbers in yellow regions indicate the percentage of genes that either lack homologous sequences (lower left corner) or contain homologous sequences in both A. brassicicola ( Ab) library and 3-fungi library (upper right corner). The numbers in pink regions (upper left) indicate the percentage of genes with homologous sequences in 3-fungi library but not in Ab library, while numbers in green regions (lower right) indicate the percentage of genes with homologous sequences in the Ab library but not in the 3-fungi library.
