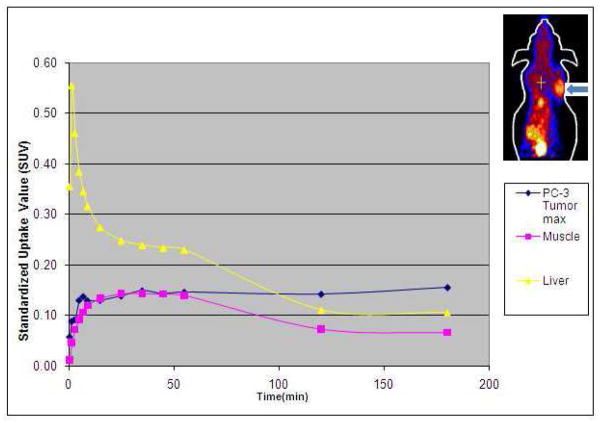
Figure 2.
Representative 3h duration time-activity curves obtained from regions of interest placed over PC3 tumor (arrow on mouse image in top right corner), liver and muscle on dynamic microPET images. Note the early rapid decline in the hepatic activity with a steady decline in both the liver and muscle uptake levels after one hour. The tumor uptake level rises rapidly reaching a plateau with continued slow rise. After 2h, the tumor uptake level is higher than the uptake levels in the liver and the muscle.

