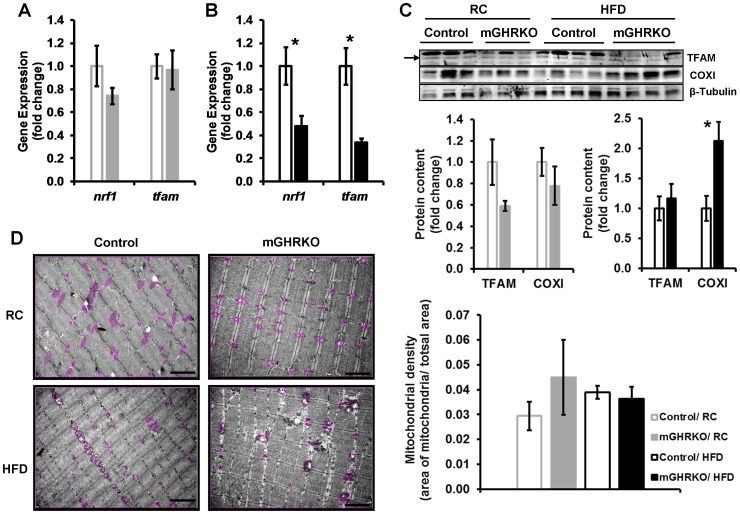
Figure 2. Mitochondrial content is not altered in the muscle of the HFD-fed mGHRKO mice.
mRNA expression of nrf1 and tfam were determined by real-time PCR in quadriceps muscles of A. 16 wk-old RC-fed (n = 6 mice/genotype), and B. 14wk HFD-fed (n = 14–16/group) control and mGHRKO mice. Each sample was probed three times and gene expression was normalized to β- actin (A) or gapdh (B) and represented as a fold change when compared to respective control (either RC- or HFD- fed). C. Protein content of TFAM and COXI were determined in protein lysates isolated from quadriceps muscle of RC- and HFD- fed control and mGHRKO mice (n = 3–4/group). β- tubulin was used to determine equal loading (top). The protein content was normalized to that of β- tubulin, and represented as a fold change compared to respective control (either RC- or HFD- fed) (bottom). Arrow indicates appropriate TFAM band. D. Electron micrographs of quadriceps muscle of 16wk-old or 14wk-HFD-fed mice (n = 3–5/group; representative images are shown). The mitochondria in the section are encircled. Scale bar represents 2 µm (left). The area of the mitochondria was quantified using ImageJ software and mitochondrial density was determined as a ratio of the total area of the mitochondria to the total area of the field (right). All values are represented as mean ± S.E.M. *- p≤0.05, One-way ANOVA.

