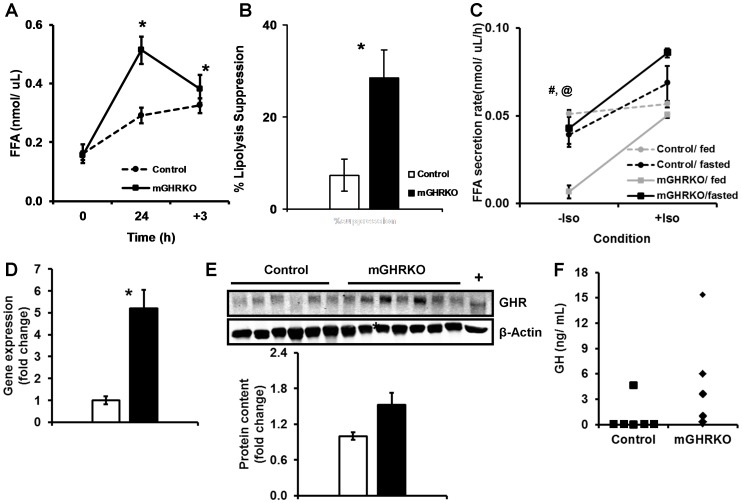
Figure 6. Adipose tissue of the fasted mGHRKO mice is more lipolytic than that of control mice. A.
FFA levels were determined in the serum of 10–12-wk HFD-fed mice at baseline (0), after 24 h fasting (24), and after 3 h of re-feeding (+3). B. The suppression of lipolysis was determined as the percent change in FFA levels at the start and end of the re-feeding phase. C. FFA secretion rate was determined in adipose tissue explants of fed and 24 h fasted 14wk HFD-fed mice either in the absence (−Iso) or presence (+Iso) of 1 µM isoproterenol (n = 2–4/group). D. mRNA expression of ghr was determined by real-time PCR in the epididymal adipose tissue of 14wk-HFD-fed mice (n = 7/group). Each sample was probed three times and gene expression was normalized to gapdh and represented as a fold change when compared to control. E. Protein content of GHR was determined in protein lysates isolated from epididymal adipose tissue 14wk-HFD-fed control and mGHRKO mice. Liver lysate was used as a positive control (+) (n = 11–15/group, representative blots are shown). β-actin was used to determine equal loading (top). The protein content of GHR was normalized to that of β-actin, and represented as a fold change compared to controls (bottom). F. Serum GH levels in the fed state were measured in 14-wk HFD-fed control and mGHRKO mice. Each point on the graph represents an individual mouse (n = 6–8/group). All values are represented as mean ± S.E.M. *− p≤0.05 HFD-fed control versus HFD-fed mGHRKO, #− p≤0.05 mGHRKO/fed versus mGHRKO/fasted, @− p≤0.05 control/fed versus mGHRKO/fed, One-way ANOVA.

