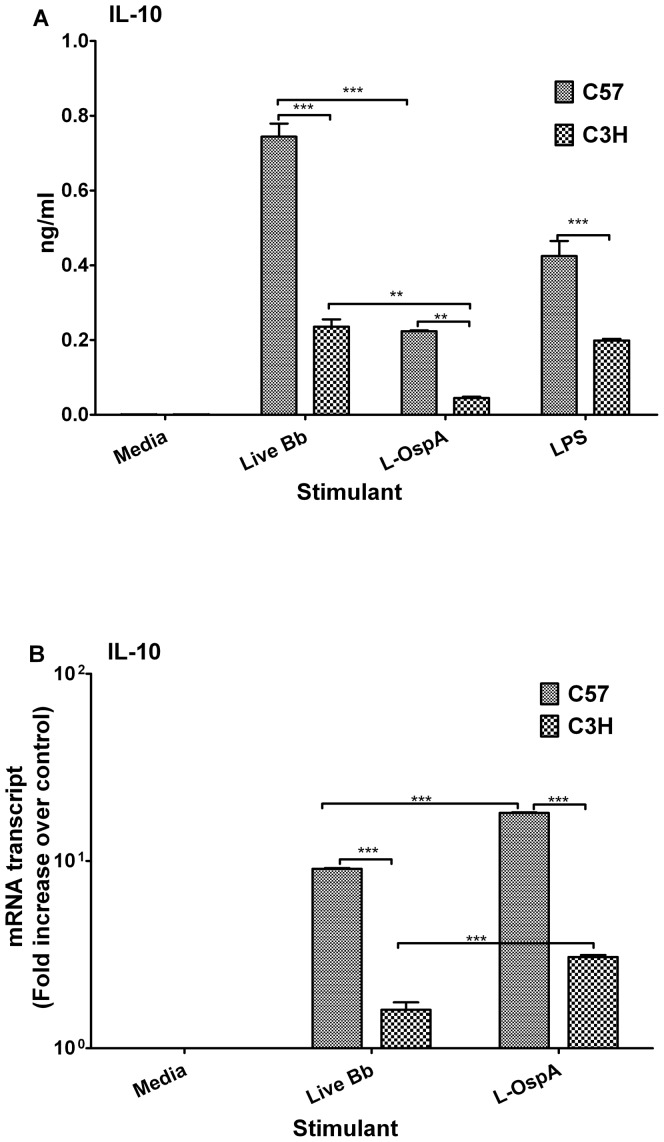
Figure 2. IL-10 is more highly expressed by macrophages of the Lyme disease-resistant mouse than by those of the disease-susceptible mouse.
BMDM cultures were established as indicated in Fig. 1 and cell-free culture supernatants and RNA samples were collected after 24 h of incubation. (A) IL-10 protein concentrations were quantified using ELISA. (B) IL-10 mRNA gene transcripts were quantified by SABiosciences RT2 Profiler™ PCR Array as indicated in Fig. 1B. Results are presented as fold increase over control (the level in unstimulated cells). Data were analyzed using a one- or two-way ANOVA followed by a Bonferroni post-hoc test (GraphPad Prism 5). Significance was established at P<0.001 = ***, P<0.01 = ** and P<0.05 = *. Each bar represents the mean ± standard deviation for duplicate cultures. Data are representative of two independent experiments, with similar results.

