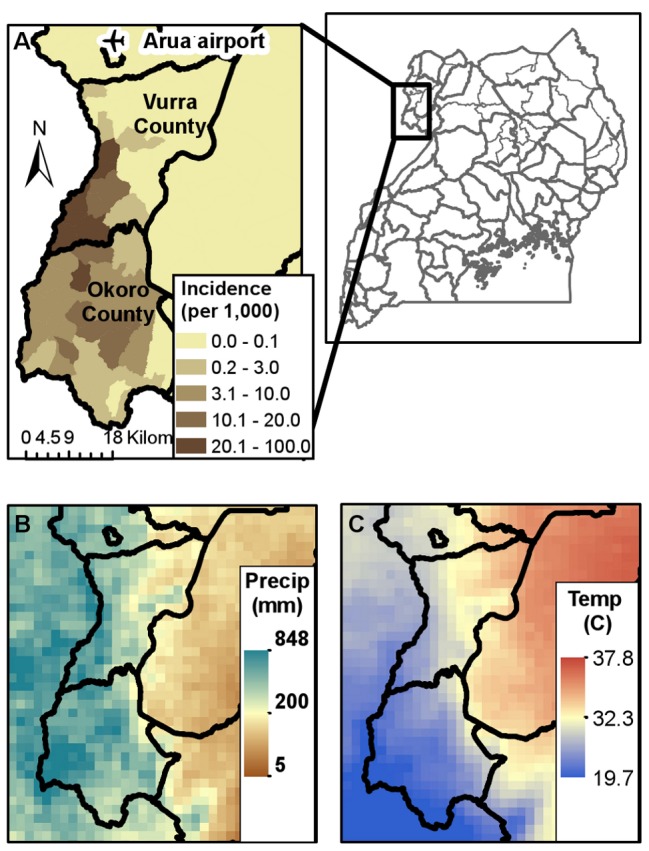
Figure 1. Spatial distributions of plague, temperature, and rainfall in West Nile region of Uganda.

(A) Reported cumulative plague incidence per 1,000 population from 1999–2007 in Vurra and Okoro counties of Uganda. (B) Average August rainfall (mm) and (C) average February maximum temperatures (°C) in northwestern Uganda. Temperature and rainfall averages were based on data from 1999–2009 generated using a 2 km Weather Research Forecasting (WRF) model [68].
