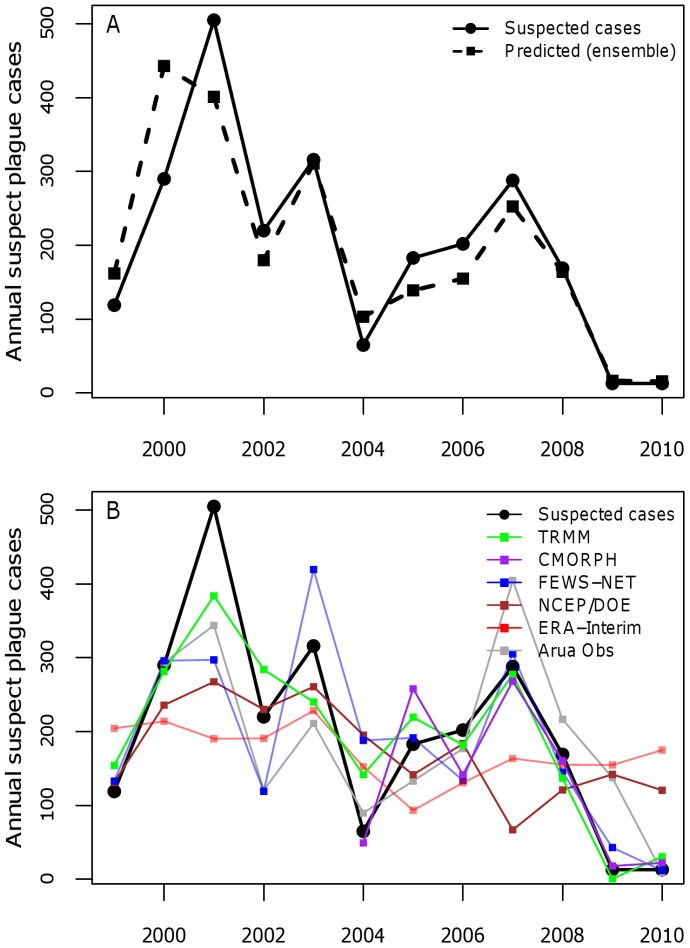
Figure 3. Annual number of observed versus predicted suspect plague cases.
(A) Plot of annual number of observed vs. predicted number of suspect human plague cases from the best-fit regression model using the meteorological ensemble dataset that uses a weighted average of all of the rainfall and temperature datasets included in this study (see Table 2 for model details). (B) Predicted number of suspect human plague cases from the best-fit regression model using each of the individual rainfall datasets.

