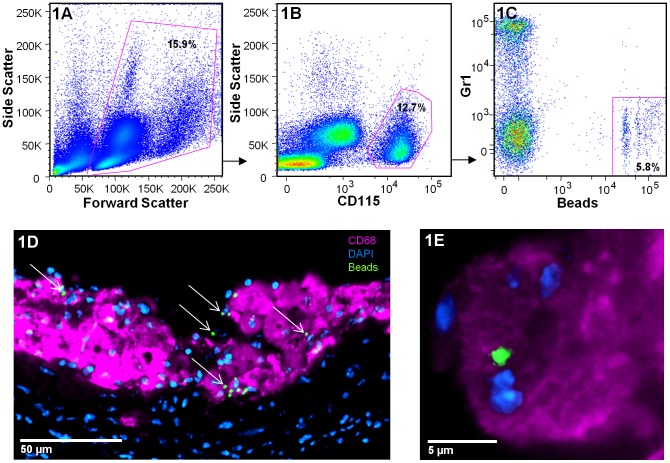
Figure 1. Verification of monocyte subpopulation bead-labeling. A.
–C) Flow cytometry gating strategy used to calculate the monocyte subpopulation bead-labeling efficiency in the blood. After gating on live cells (A), monocytes are detected by their high expression of CD115 (B). In this representative plot, 12.7% of leukocytes are monocytes. Monocytes can then be separated in 2 major populations based on their expression of Gr1 (C). In this example, 5.8% of total monocytes are bead-positive Gr1lo. Specific labeling of monocytes can also be visualized in plaques via sectioning of the tissue and immunofluorescence. D) A representative image of an atherosclerotic plaque after sectioning of the aortic sinus acquired 5 days following monocyte subpopulation labeling. Bead-positive cells are indicated by arrows. E) Beads can be seen to associate with CD68+ macrophages.

