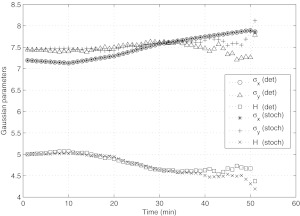
Figure 12.
Deformation of the cell surface parameters σx, σy, H, as a function of time as obtained from the numerical simulation. Stochastic fluctuations are taken to be 10% of the deterministic base flow. The plot should be compared with the experimental run shown in Figure 7.

