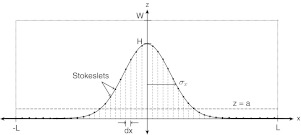
Figure 8.
Schematic of computational domain −L < x < L, −L < y < L, 0 < z < W. Cell surface (z > a) is shown as cut-off Gaussian shape, with plate (dashed) at z = a. Stokeslets are placed on the cell surface and on a regular grid throughout the computational domain. The spacing on the cell surface is obtained from an even distribution of points along the x-direction, then projected up to the cell surface. More details in text.

