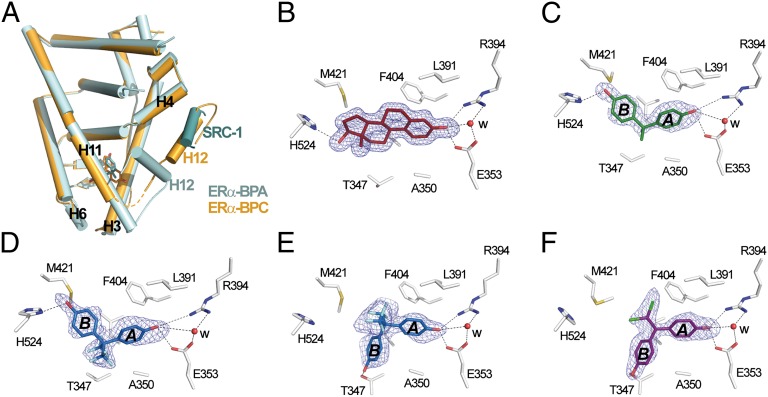
Fig. 3.
Two different binding modes of bisphenols. (A) The whole structure of the ERα Y537S LBD in complex with SRC-1 NR2 and BPA (cyan) superimposed on that of WT ERα LBD bound to BPC (orange). The orange dashed line denotes residues not visible in the electron density map. (B–F) Interaction networks of E2 (B), BPA (C), BPAF (D and E), and BPC (F) with LBP residues in ERα. Oxygen, nitrogen, sulfur, fluorine, and chlorine atoms are colored in red, blue, yellow, cyan, and green, respectively. Hydrogen bonds are indicated by black dashed lines. For clarity, not all protein–ligand interactions are depicted. The blue electron density represents a Fo-Fc simulated annealing omit map contoured at 3σ.

