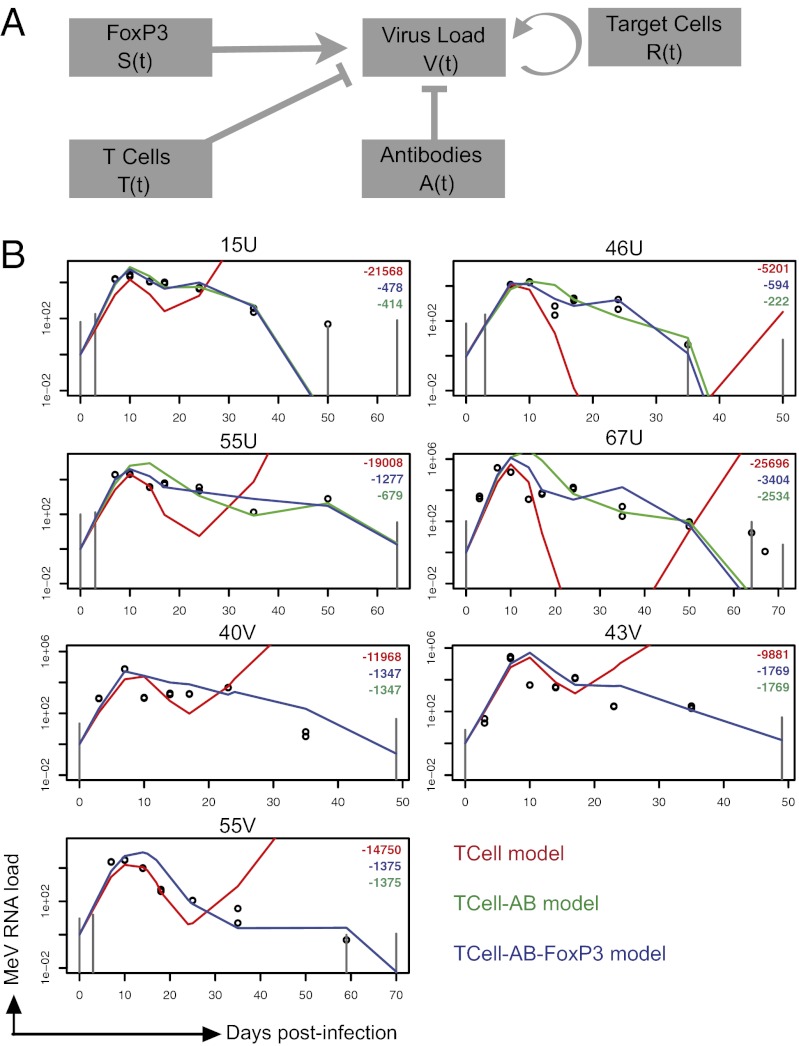
Fig. 3.
Mathematical models for the process of within-host clearance of MeV RNA. (A) Diagram of the linear model. The virus load was directly modulated by different immune components. V(t) denotes the virus load at time t, R(t) the abundance of target cells (lymphocyte concentration), T(t) the abundance of MeV-specific IFN-γ–producing T cells, A(t) the abundance of MeV-specific antibodies (PRN titer), and S(t) the immunosuppressive activity (FoxP3 mRNA). (B) Models were fitted by maximum likelihood to the virus load data (see Materials and Methods). Colors indicate different versions of the model. The T cell-AB-FoxP3 model (Eq. 1; blue line) takes T cells, antibodies, and FoxP3 into account; the T cell-AB model (green line) takes only T cells and antibodies into account; and the T-cell model (red line) takes only T cells into account. The models are fitted for each animal individually (fits in which all parameters except 1 are common between animals are provided in Fig. S9). Log-likelihood from the different models is shown in right upper quadrants with colors corresponding to lines. The observed MeV RNA load is shown in open circles. Gray vertical lines mark the estimated lowest detection level of the qRT-PCR assay at given time points. Macaques are identified at the top of individual graphs.

