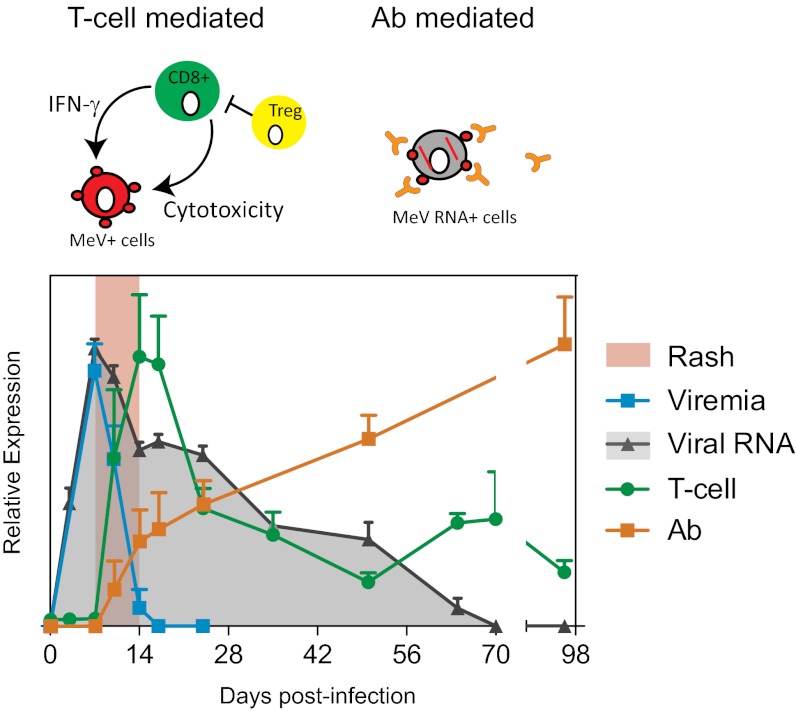
Fig. 4.
Rash, viral dynamics, and T-cell and antibody dynamics. Results of viremia, viral RNA, MeV-specific IFN-γ production, and PRN titer are plotted as the average from the study macaques + SEM. T-cell response data (green) are calculated as the sum of the H-, F-, and N-specific IFN-γ responses and plotted on a linear scale of 0–800 spot-forming cells per 106 PBMCs. Antibody response data from PRNT (orange) are plotted on a linear scale of 0–8,000 reciprocal titer. Viremia (cyan) and viral RNA (gray) are plotted in a logarithmic scale with an axis of 0–5 log tissue culture 50% infectious dose per 106 PBMCs or 0–105 MeV/GAPDH × 5,000. Based on the mathematical models, we show that viral dynamics, although initially regulated by T cells, require antibody to eliminate viral RNA.

