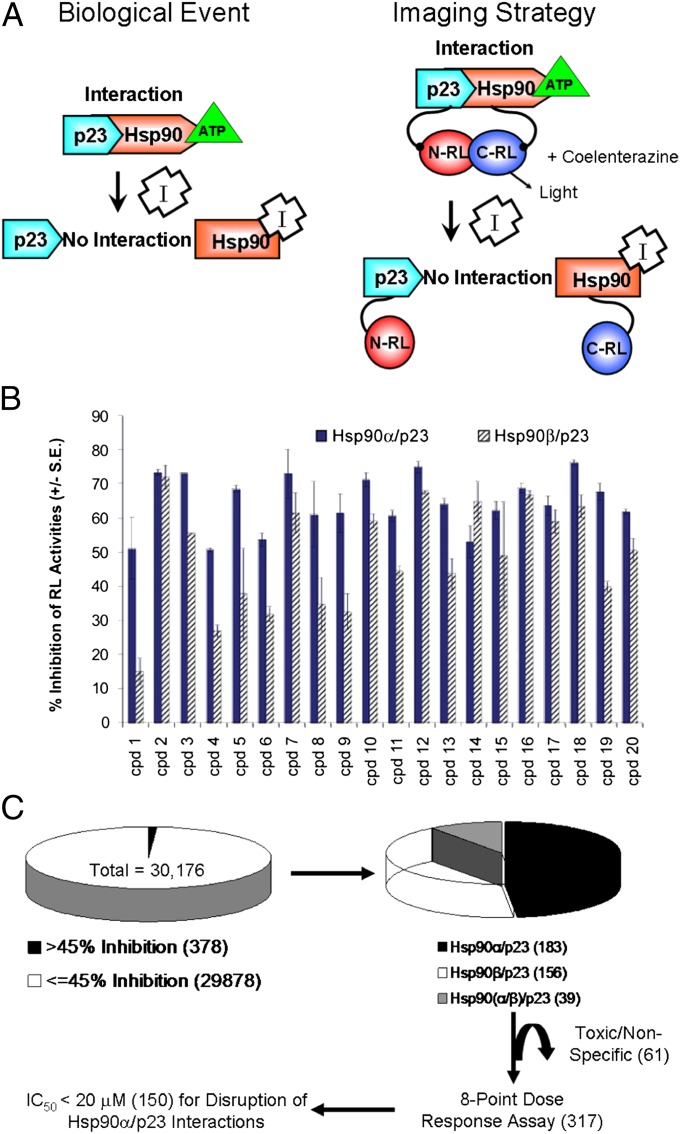
Fig. 1.
HTS of Hsp90 inhibitors using the split RL complementation system and evaluation of lead compounds by BLI. (A) The biological event that we are monitoring (i.e., disruption of Hsp90/p23 interactions by Hsp90 inhibitors) is shown on the left. The schematic diagram for monitoring Hsp90/p23 interaction using the split RL complementation system is shown on the right. The two interacting proteins, p23 and Hsp90, are fused to the inactive N-RL and C-RL portions of RL through a peptide linker (Upper). In the presence of ATP, interactions between p23 and Hsp90 bring N-RL and C-RL into close proximity and lead to complementation of RL enzyme activity and the production of light in the presence of the substrate coelenterazine. (Lower) Binding of Hsp90 inhibitors (I) to Hsp90-CRL leads to a conformation change and prevents ATP from binding, thus diminishing the interaction between N-RL–p23 and Hsp90–C-RL and complementation of RL activity and reduced light output. The effect of Hsp90 inhibitors on cell proliferation is monitored by FL imaging upon introduction of the EGFP-FL fusion reporter. (B) HTS using the 1,280-compound LOPAC for assay standardization. 293T cells stably expressing the Hsp90α/p23 (solid bars) or Hsp90β/p23 (striped bars) split RL reporter constructs were plated in 384-well white plates for 24 h. Baseline RL signals were determined by a luminescence reader upon the addition of the RL substrate EnduRen. Each compound in the LOPAC library (20 μM) or carrier (control) then was added to a well, and RL signals at 24 h after treatment were normalized to those of time 0 h and carrier control-treated. The experiment was repeated twice. The percent of inhibition of RL activity by the top 20 compounds is shown as mean ± SEM. (C) Flow diagram for HTS of a 30,000 small-molecule compound library. Initial screening was performed as in A, but only one well was used for each compound at 8.3 μM. IC50 values for the compounds that resulted in >45% inhibition of Hsp90α/p23 or Hsp90β/p23 interactions were determined by an eight-point dose–response experiment (0.3–20 μM) (Table 1). Toxic compounds were eliminated. Numbers within parentheses denote the number of compounds at each stage during the screening.

