Fig. 3.
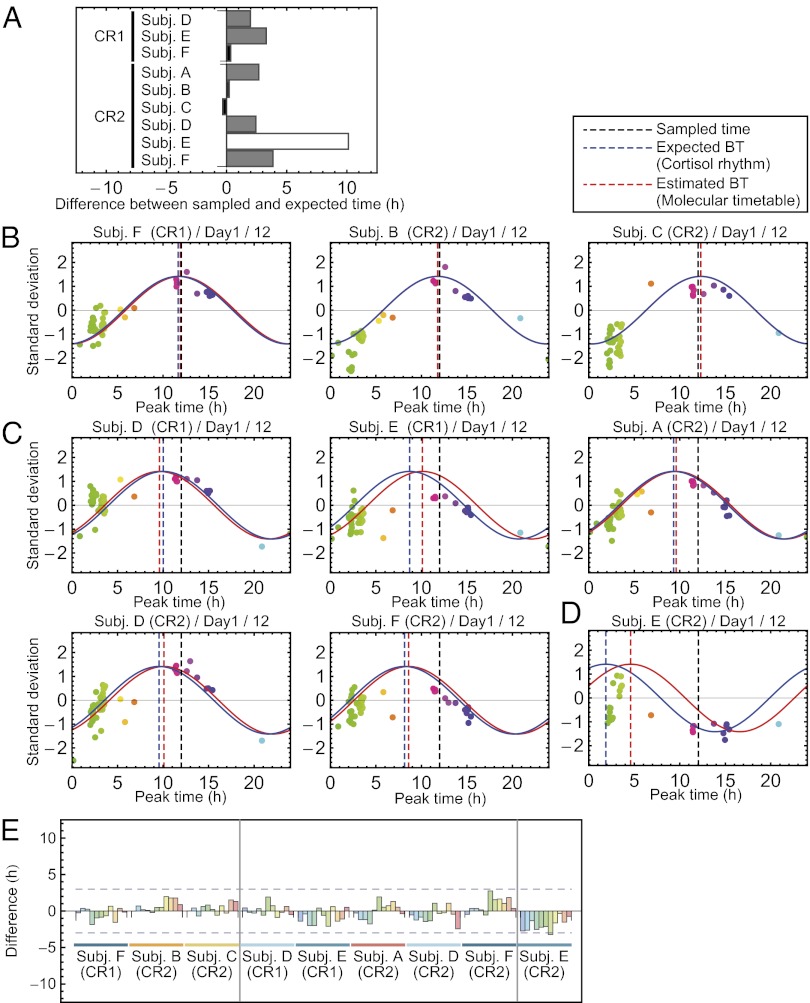
Estimation of human body time. (A) Difference between expected body time and sampled time. Nine sample sets for body-time estimation were classified into three groups by the magnitude of the difference: small (black), moderate (gray), and large (white). (B–D) Body-time estimation at 12 h on the first day for nine sample sets in small (B), moderate (C), and large (D) body-time difference groups. Colors of the dots indicate the molecular peak times of each metabolite. Peak time of the red cosine curves indicates estimated body time and peak time of the blue indicates the time of the expected body time. The smaller the distance between red and blue curves, the greater the accuracy of the measurement. Dashed vertical lines show the estimated body time (red), expected body time (blue), or the time the sample was taken (black). In all subjects, expected body time (based on cortisol rhythm) and estimated body time (based on molecular timetable) were similar, indicated by the close proximity of the blue and red dashed lines. (E) Summary of body-time estimation. Difference between expected and estimated body time for all estimated samples is shown. The leftmost three samples were ones in the small difference group, the middle five samples were in the moderate difference group, and the rightmost sample was in the large difference group. All samples estimated internal body time within or around 3-h differences between expected and estimated body time. BT, body time.

