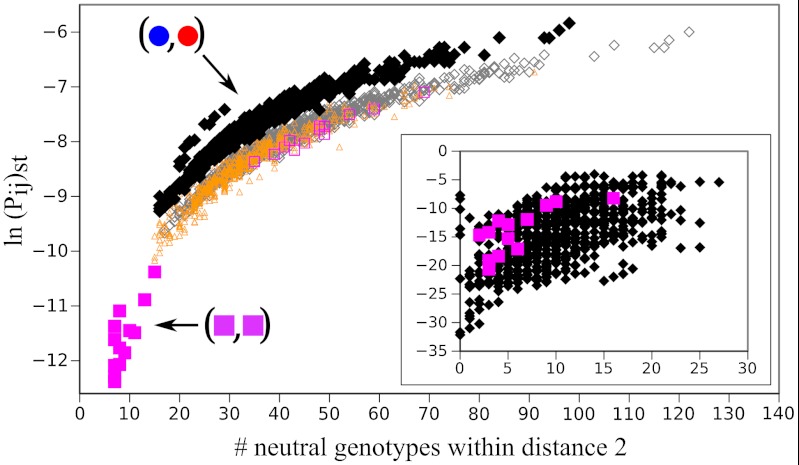
Fig. 3.
Strong tendency towards mutationally robust genotypes during SUBF. Steady-state populations  were obtained from the SUBF simulations in Fig. 2D (θ = 0.5 and d = 1). The scatter plot shows ln(Pij)st versus the number of genotypes that are within two point mutations from (i,j) in the network. Data points for the 24 bridge pairs and 1,728 subfunctionalized pairs are plotted, respectively, by filled magenta squares and black diamonds. The plot thus contains all 1,752 genotypes with maximum fitness at steady state (among all 34,410 genotypes—single genes and gene pairs—for XA and XB in Fig. 1A). The corresponding scatter plot for a randomized network topology is shown in the Inset. Results from a control simulation that artificially eliminated the epistatic barriers are shown by the open symbols. Magenta squares, orange triangles, and gray diamonds represent data points for bridge, mixed, and SUBF pairs, respectively. The inclusion of mixed pairs with ad hoc optimal fitness leads to increased numbers of neutral genotypes adjacent to the bridge pairs and thus abolishes the separation between bridge and SUBF pairs observed in the original model. Nevertheless, a tight correlation between ln(Pij)st and genotype entropy is maintained and SUBF pairs remain the most populated steady-state genotypes.

