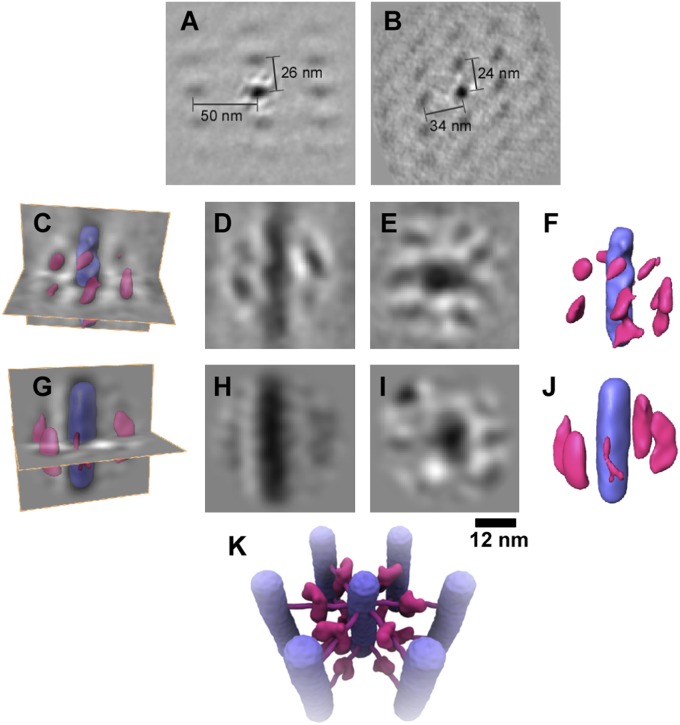
Fig. 3.
Subtomogram averages of the fiber arrays. Subregions of the cryotomograms were aligned and averaged to reveal additional structures surrounding the fibers. (A) Section through the array of ring fibers, with the region in the center showing the averaged density surrounded by the array of fibers. (B) Equivalent view of the dot fiber array. The variable spacing might arise from sectioning artifacts and/or oblique fibril orientations. (C) Rendered views of the ring average superposed on density sections. (D and E) Long- and cross-sections of the averaged ring fiber. (F) Rendered view of the averaged fiber with the surrounding structures. The fiber is shown in purple and the additional structures in pink. (G) Rendered view of the dot average superposed on density sections as above. (H and I) Long- and cross-sections of the dot fiber average. (J) Rendered view of the averaged fiber with the surrounding structures, colored as in F. The differences in dot and ring structures most likely arise from the lower resolution obtained for the dot average. The defocus needed to obtain sufficient contrast in cryosections causes a white halo around high-density (dark) features; therefore, obscuring regions of contact between the central fiber and surrounding structures. (K) Illustration of the deduced arrangement of cross-bridges between the fibers. Fibers are in purple, and cross-bridge structures are in pink.

