Fig. 3.
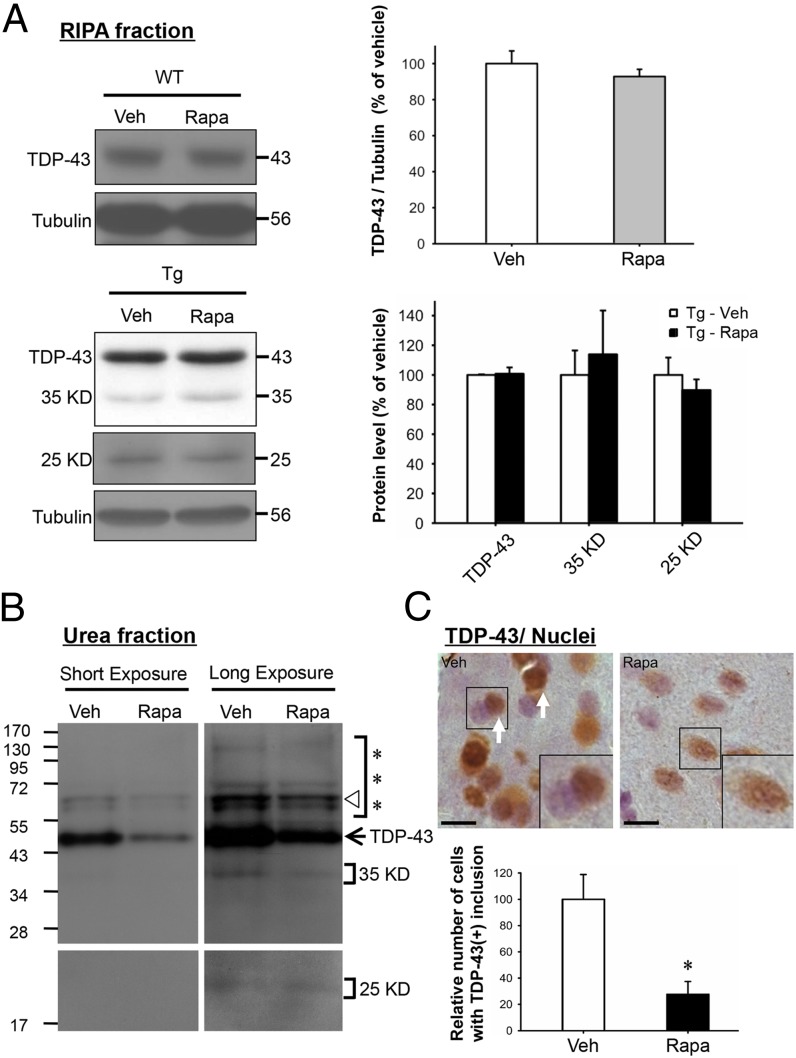
Rapamycin effects on the solubility and subcellular distribution of TDP-43 in FTLD-U mouse brains. (A) Western blot analysis of TDP-43 in the soluble/ RIPA fractions of extracts from the cortex and hippocampus regions of 6-mo-old WT (Upper set of panels and histogram) and TDP-43 Tg mice (Lower set of panels and histogram) treated with rapamycin or vehicle. The RIPA fractions of the extracts were prepared as described in Materials and Methods and analyzed by Western blotting. Note that rapamycin and vehicle treatments resulted in similar levels of the different TDP-43 species in either the WT or the Tg mouse samples. Amounts of the 35-kDa and 25-kDa TDP-43 fragments in the WT extract were too low to be analyzed. (B) Western blot analysis of TDP-43 in the urea-soluble fractions of brain extracts. The arrow points to the unmodified form of TDP-43 on the gel. The triangle is an anti–TDP-43 hybridizing band of unknown origin. ***, represents the gel region containing high molecular weight, polyubiquitinated TDP-43 species. Result is representative of three independent experiments. (C) Immunohistochemical staining of TDP-43 and nuclei of brain sections from TDP-43 Tg mice treated with rapamycin or vehicle. Sections were immunohistochemically stained for detection of TDP-43 (brown) and nuclei (blue) as described in Materials and Methods. TDP-43 (+) inclusions are indicated by white arrows. One cell each from the two images are further magnified in the Lower Right corners for better visualization. (Bars, 10 μm.) Quantitative analysis of the relative numbers of TDP-43 (+) inclusions is shown in the histogram below the photo panels. Results in A and C represent the mean ± SEM of three independent experiments (n = 5 mice per group). *P < 0.05.

