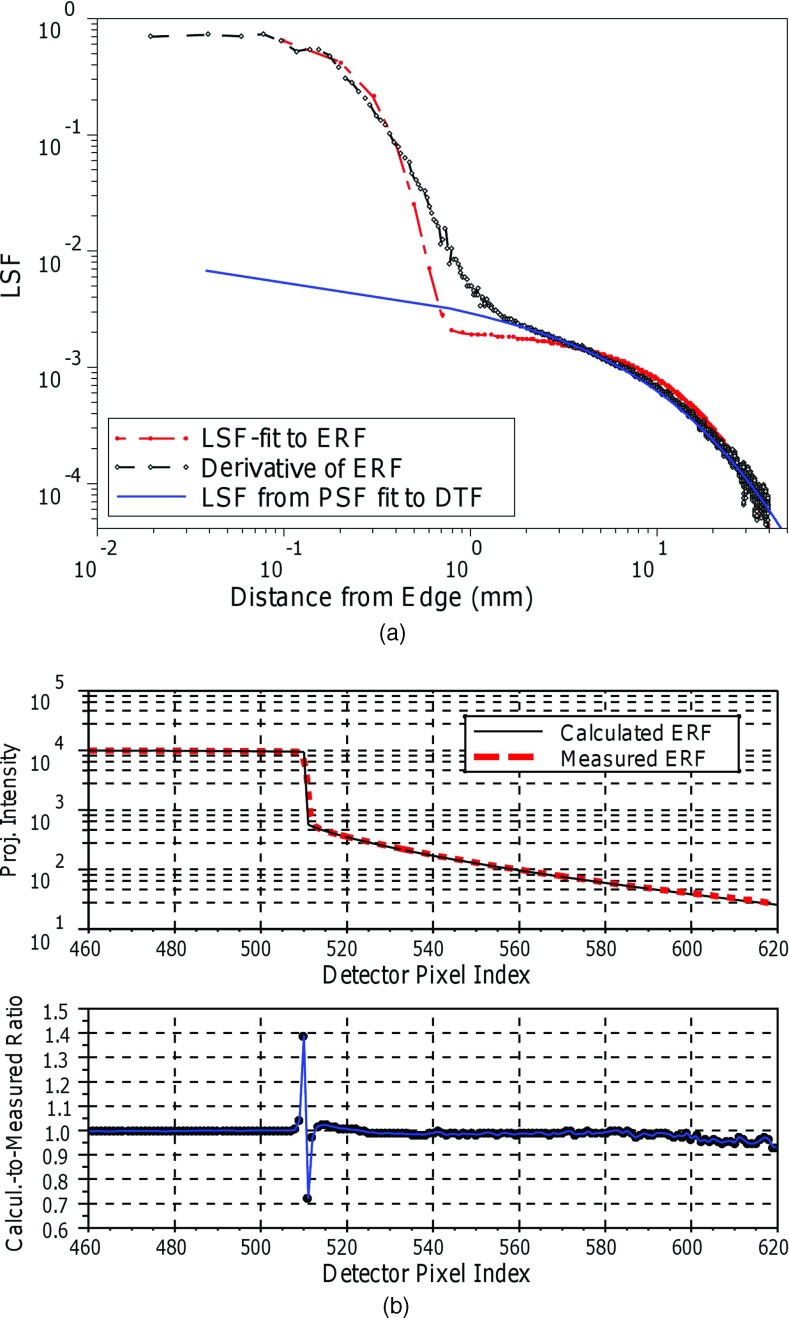
Figure 3.
(a) Comparison of the LSF models derived from fitting Eq. 7 to ERF measurements (red); fitting Eq. 4 to the DTF measurements (blue); and direct differentiation of the ERF (black) for 120 kVp. Because of the logarithm scale at the x-axis, the delta peak of the LSF derived by Eq. 4 is not shown at 0 mm. (b) Ratio of ERF derived by direct and ERF derived from LSF fit.

