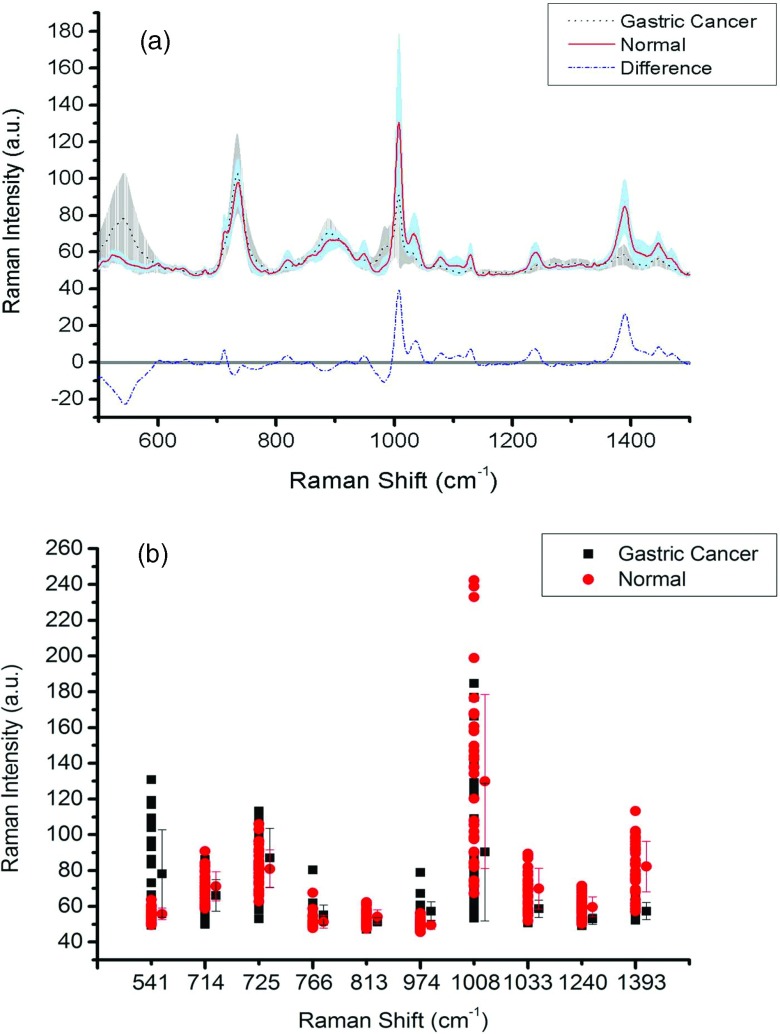
Figure 2.
(a) Comparison of the normalized mean spectra of serum RNA samples obtained from 31 gastric cancer patients versus 34 healthy volunteers. The shaded areas represent the standard deviations (SD) of the means spectra. The stripe shadow represents the standard deviations of the gastric cancer mean spectra, while the gray shaded area indicates the standard deviations of the normal mean spectra. Also shown at the bottom is the difference spectrum. (b) Comparison of the mean intensities and standard deviations of selected peaks with the most distinguishable differences between gastric cancer and normal serum RNA.

